Distracted Driving in Washington State, 2019:
Crash Statistics, Enforcement, and Results from the
Statewide Observation Survey
Early Impacts from the 2017 Driving Under the Influence of
Electronics Act (SSB 5289)
Darrin T. Grondel, Ed.D. Director
Staci Hoff, Ph.D., Research Director
March 2020

Publication and Contact Information
For report and data questions:
Staci Hoff, PhD
Research Director, Research and Data Division
Phone: 360.725.9874
Email: [email protected]
For distracted driving program questions:
Erika Mascorro
Program Manager, Programs and Services Division
Phone: 360.725.9882
Email: [email protected]
For policy questions:
Shelly Baldwin
Legislative and Media Relations Director, Legislative and Media Relations Division
Phone: 360.725.9889
Email: [email protected]
Washington Traffic Safety Commission
621 8
th
Ave SE, Suite 409
PO Box 40944
Olympia, WA 98504-0944
Accessibility Information: Persons with disabilities may request this information be prepared and
supplied in alternate formats by calling the Washington Traffic Safety Commission at (360) 725-9860.
Persons who are hearing impaired may call Washington State Telecommunications Relay Service by
dialing 7-1-1 and asking to be connected to (360) 725-9860.
- 1 -
TABLE OF CONTENTS
EXECUTIVE SUMMARY OF REPORT FINDINGS ........................................................................... - 2 -
INTRODUCTION AND BACKGROUND ......................................................................................... - 3 -
DISTRACTED DRIVING CRASHES ................................................................................................ - 6 -
Figure 1: CRASHES, Fatalities Involving a Distracted Driver ................................................... - 6 -
Figure 2: CRASHES, Fatalities Involving a Distracted Driver by Quarter 2016-2018............... - 7 -
Figure 3: CRASHES, Serious Injuries Involving a Distracted Driver ......................................... - 8 -
Figure 4: CRASHES, Evident and Possible Injuries Involving a Distracted Driver .................... - 9 -
Limitations Regarding Distracted Driving Crash Analysis....................................................... - 9 -
DISTRACTED DRIVING ENFORCEMENT .................................................................................... - 10 -
Figure 5. ENFORCEMENT, Distracted Driving Courts of Limited Jurisdiction Case Filings .... - 10 -
Figure 6. ENFORCEMENT, Cell Phone Use 2
nd
+ Offense ...................................................... - 11 -
DISTRACTED DRIVING OBSERVATION SURVEY ........................................................................ - 11 -
STATEWIDE RESULTS ........................................................................................................... - 12 -
Figure 7. DRIVER DISTRACTION RATES, All Distractions ...................................................... - 12 -
Figure 8. DRIVER DISTRACTION RATES, By Type of Distraction ........................................... - 13 -
Figure 9. SOURCE OF DRIVER DISTRACTION, Proportion of All Distractions ....................... - 14 -
COUNTY RESULTS ................................................................................................................ - 15 -
Figure 10. DRIVER DISTRACTION RATES, By Sampled County ............................................. - 15 -
Figure 11. DRIVER DISTRACTION RATES, By County, Type of Distraction ............................ - 16 -
Figure 12. SOURCE OF DRIVER DISTRACTION, By County, Proportion of All Distractions .... - 17 -
DISCUSSION ............................................................................................................................ - 18 -
REFERENCES ............................................................................................................................ - 19 -
APPENDIX A: Distracted Driver Observation Survey Data Collection ...................................... - 20 -

- 2 -
EXECUTIVE SUMMARY OF REPORT FINDINGS
On July 23, 2017 Washington enacted the Driving under the Influence of Electronics Act. Law
enforcement began intensely enforcing that law in January 2018. This report describes the
information on distracted driving available through 2019.
Crashes Involving Distracted Drivers:
• In 2018 there was an unprecedented single-year reduction in fatalities involving a distracted
driver (-25 percent), appearing to be an impact of the enhanced distracted driving law. While
early fatality estimates from 2019 show a slight increase from 2018 (five percent), the
decrease from 2017 is sustained.
• There was no clear reduction in serious injuries after the new distracted driving law went
into effect. However, considering the limited historical information available for distracted
driver involved serious injuries (since 2013), the highest single-year reduction (-5 percent)
to date occurred in 2018.
• A greater decline, both in total numbers and proportion of injuries, has been achieved for
persons with evident and possible injuries from crashes involving distracted drivers. These
declines are consistent since 2015, so it is unclear what effect the enhanced distracted
driving law has had on overall injuries.
Distracted Driving Enforcement:
• Under the new law, enforcement officers issued 33,825 distracted driving citations in 2018 and
37,402 in 2019. This is compared to 24,226 citations in 2016: the last complete year of citations
issued under the previous laws for hand-to-ear cell phone use and texting. This indicates the
new law is easier to enforce, which was one of the intents of the new law.
• From 2018 to 2019 law enforcement issued 1,769 citations for “dangerously distracted”—a
secondary violation that was established under the new law to address non-cell phone related
distracted driving offenses.
• Since the law took effect in July 2017 law enforcement has issued 534 second or subsequent
distracted driving citations, and that number increases as the pool of drivers receiving a first
offence also increases.
Statewide Distracted Driving Observation Survey
• The statewide estimate of Washington’s driver distraction rate in 2019 was 6.8 percent. The
driver distraction rate was highest on city streets at 8.1 percent, followed by county roads
(6.5 percent) and state routes (6.6 percent).
• From 2016 to 2018 a similar distracted driver observation survey was conducted only at
intersections, and although the results are not comparable to this survey, the distracted
driver rate on city streets (where most intersections from the previous survey reside) was
nearly identical to the 2018 survey conducted at intersections (8.1 versus 8.2 percent).
• Two of every three distracted drivers in Washington are either using or talking on a hand-
held cell phone (67.9 percent). This rate is highest on city streets (78.1 percent or four of
every five distracted drivers) and lowest on state routes (63 percent). Other distractions
include any activity that diverts attention and engagement from driving, such as grooming.

- 3 -
INTRODUCTION AND BACKGROUND
Driver distraction has always been a focus of prevention among the traffic safety community.
Driver distraction includes all activities that divert attention and full engagement from the task of
driving, including general inattention (lost in thought), smoking, eating, grooming, reading,
interactions with passengers or vehicle controls, and electronic device use. Healthy People 2020
identifies motor vehicle crashes due to distracted driving as a research area needed to better
understand trends, causes, and prevention strategies (CDC, 2018). Numerous simulator studies,
closed-track, in-vehicle camera, and other studies have shown significant increases in serious
driving errors resulting from cell phone use while driving.
Traffic safety researchers agree that driver distractions of all kinds can greatly increase the risk that
a crash will occur. Despites the public’s knowledge of the dangers, distracted driving is still very
common. According to the 2018 AAA Foundation Traffic Safety Culture Index:
• In the past month, 52.1 percent of drivers reported talking on a hand-held cell phone, 41.3
percent reported reading text/email, and 32.1% reported typing text/email while driving.
• Despite the high frequency of cell phone use while driving, more than 95 percent of drivers
view reading or typing a text/email while driving to be very or extremely dangerous, and
80 percent of drivers view talking on a hand-held cell phone to be very or extremely
dangerous.
• The majority of drivers (88 percent) support laws against reading, typing or sending text or
email messages and 75 percent support laws against holding and talking on a cell phone
while driving.
In 2017 Washington passed stricter distracted driving laws (RCW 46.61.672 and RCW 46.61.673).
The new laws ban all hand-held cell phone use while driving, even when stopped in traffic or at a
traffic light. In addition, the cost charged per ticket increases for subsequent violations. A new
secondary offense defined as “dangerously distracted” was also created. A secondary dangerously
distracted citation may be issued to a person who engages in any activity not related to the
operation of the vehicle in a manner that interferes with the safe operation of the vehicle.
Dangerously distracted citations result in a $99 fee in addition to the primary offense. Finally, the
new laws make these infractions available to automobile insurance companies.
The new laws became effective on July 23, 2017. The majority of law enforcement delayed
enforcement of these new laws in lieu of education opportunities with drivers. During this time,
the Washington Traffic Safety Commission (WTSC) implemented an education campaign to ensure
Washington drivers were aware of and understood the new law. The campaign ran from July 10 to
July 30, 2017. The campaign was produced in six different languages and garnered 41.1 million
impressions and more than two million video views. The campaign also received excellent media
coverage earning 1.4 billion new media mentions.
- 4 -
Full enforcement began in January 2018. From July to December 2017, when the new law went
into effect, just over 7,000 tickets were issued statewide during the “warning” period. In the first
six months of 2018, over 20,000 tickets had been issued under the new laws.
In June 2018 the King County Target Zero Task Force sponsored a similar traffic safety culture index
survey resulting in responses from 900 King County residents. Among King County adults:
• 13 percent reported talking on a hand-held cell phone and 34 percent reported talking on a
hands-free cell phone regularly or fairly often while driving.
• 12 percent reported typing text messages and 20 percent reported reading text messages
regularly or fairly often while driving.
• 18 percent reported using an application other than GPS regularly or fairly often while
driving.
Similar to the AAA survey, 96 percent of King County residents perceive other drivers typing on a
cell phone as a personal threat (24 percent) or very serious threat (72 percent). A large majority
(79 percent) also perceive other drivers talking on a cell phone as a personal threat (28 percent) or
very serious threat (51 percent). Finally, 83 percent perceive other drivers using apps other than
GPS as a personal threat (43 percent) or very serious threat (40 percent). Despite the perception of
threat from other drivers, three of four King County residents believe that it is very unlikely that
they would crash their car while texting on a cell phone, and only 60 percent would stop using
their cell phone while driving if they were in a crash from using their cell phone.
The King County survey showed high understanding of the new elements of the distracted driving
law, such as not using the phone at intersections for any reason or talking on a hand-held cell
phone. Unfortunately, when the survey was conducted, less than 10 percent believed it was likely
or very likely to get a ticket for talking or typing on a cell phone. Since this survey was conducted,
the King County Target Zero Task Force has used this information to focus education and outreach
efforts and support high visibility enforcement campaigns in conjunction with state efforts.
In September 2019 the WTSC commissioned a positive traffic safety culture survey resulting in
responses from 1,603 adult Washingtonians. According to the survey:
• Approximately three of four drivers (73.8 percent) know that using a hand-held cell phone
while driving is illegal, however less (67.8 percent, or two of three drivers) know that using
a hand-held cell phone while stopped at a traffic light is illegal.
• Nearly 70 percent of drivers believe that using a hand-held phone while driving is
dangerous, yet 35 percent report doing it frequently.
• Two of every three adults reported being a passenger in a vehicle of a distracted driver and
83 percent of those passengers reported intervening with the driver’s behavior.
Overall, survey respondents rated themselves as engaging in distracted driving behaviors less
frequently than others in their county. Although nearly 90 percent of respondents believe safety is
everyone’s responsibility, less than half believe other drivers actually engage in safe behaviors
(WTSC, 2019).
- 5 -
In June of each year from 2016 to 2018 the Washington Traffic Safety Commission conducted
distracted driver observation surveys at controlled intersections. In 2018 the overall driver
distraction rate dropped from 9.2 percent the previous two years to 8.2 percent, although this
reduction was not statistically significant. However, there was a significant decrease of the percent
of drivers in 2018 holding cell phones, from 5.4 percent to 3.4 percent. In 2019 the observation
survey was expanded from controlled intersections to all road types and moving traffic, including
city streets, county roads, and state highways and interstates.
This report provides an analysis of driver distraction in Washington prior to the new law’s effective
date and through 2019. This report includes analysis of injury crash data, enforcement data, and
the results of the 2019 distracted driving observation survey. The results of the observation survey
are not comparable to the 2016-2018 survey and therefore represents a new baseline for
measuring the prevalence of distracted driving on Washington roadways.
- 6 -
DISTRACTED DRIVING CRASHES
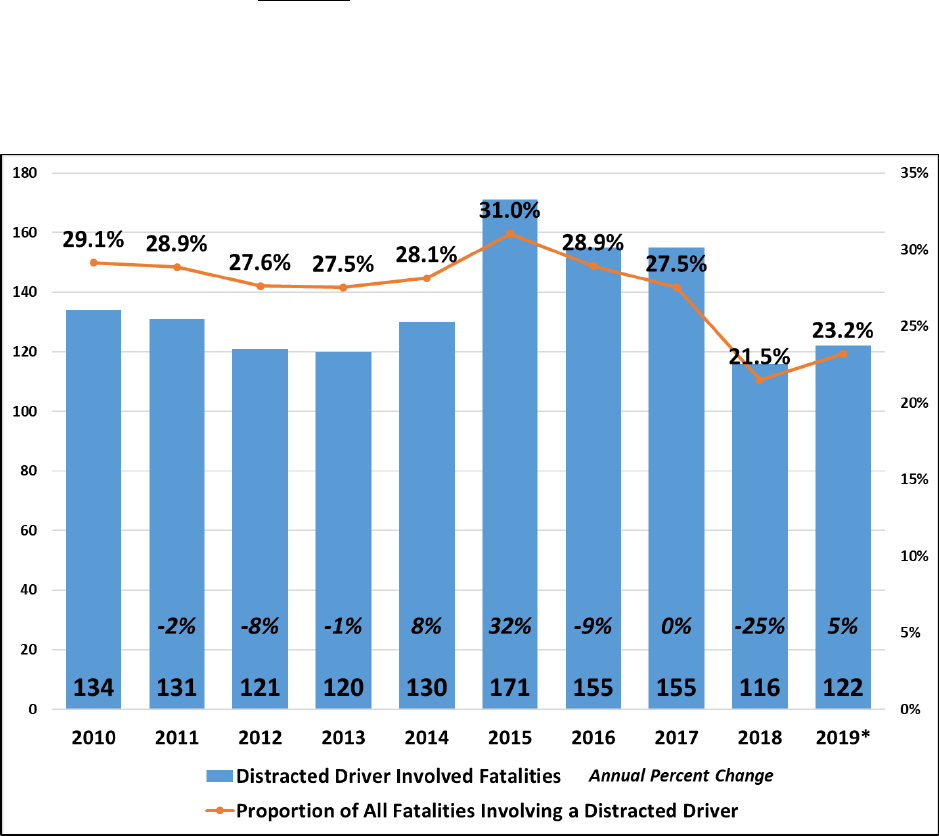
In 2015 there was an unprecedented single-year increase in fatalities involving a distracted driver
(32 percent) that coincided with a total fatality increase of 20 percent. Distracted driving claimed
171 lives in 2015. The 2015 increase in fatalities involving a distracted driver was a significant
factor in the overall increase in fatalities that year, as evident by the increase in the proportion of
total fatalities involving a distracted driver. (Figure 1). Fortunately, in 2018 there was an
unprecedented single-year reduction in fatalities involving a distracted driver (-25 percent),
appearing to be an impact of the enhanced distracted driving law that took effect on July 23, 2017.
While early fatality estimates from 2019 show a slight increase from 2018 (five percent), the
decrease from 2017 is sustained.
Figure 1: CRASHES, Fatalities Involving a Distracted Driver
Source: Washington Fatality Analysis Reporting System *Preliminary 2019 counts provided by
WSDOT
- 7 -
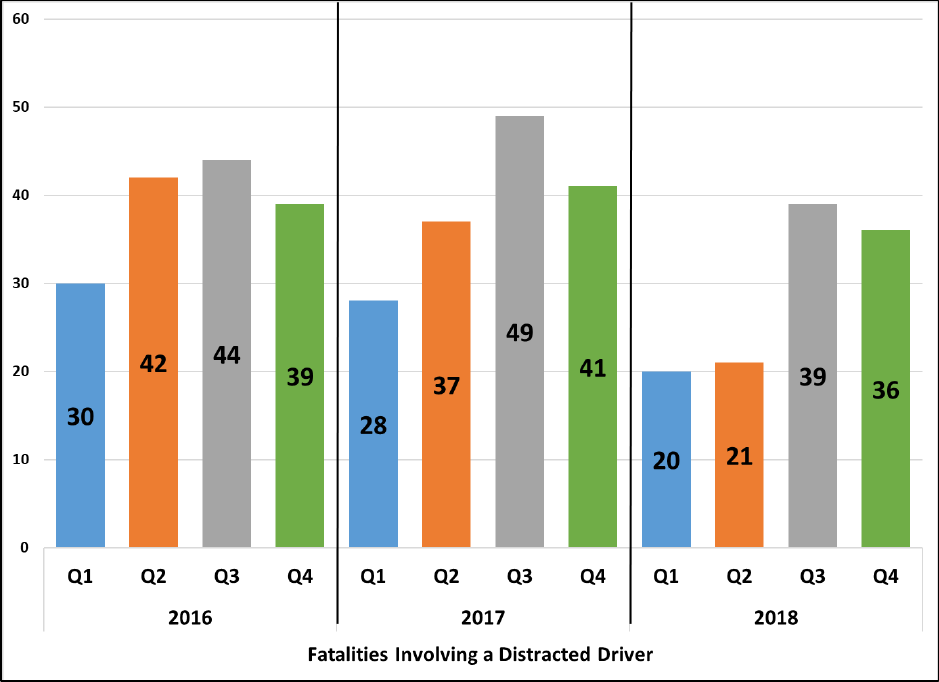
When fatalities are viewed by quarter, the majority of the reduction occurred during the first
two quarters of 2018. (Figure 2). Although the law went into effect in July 2017, most law
enforcement agreed to delay issuing citations in lieu of education about the new law. This
“grace period” ended January 2018. The annual distracted driving high visibility enforcement
campaign took place in April 2018. These events correspond with the 2018 quarter one and two
distracted driver involved fatality reductions. Although there were nearly double the number of
distracted driver involved fatalities in the last two quarters compared to the first two quarters
of 2018, both the third and fourth quarters of 2018 showed lower fatalities than those same
time periods in 2016 and 2017.
Figure 2: CRASHES, Fatalities Involving a Distracted Driver by Quarter 2016-2018
Source: Washington Fatality Analysis Reporting System
- 8 -
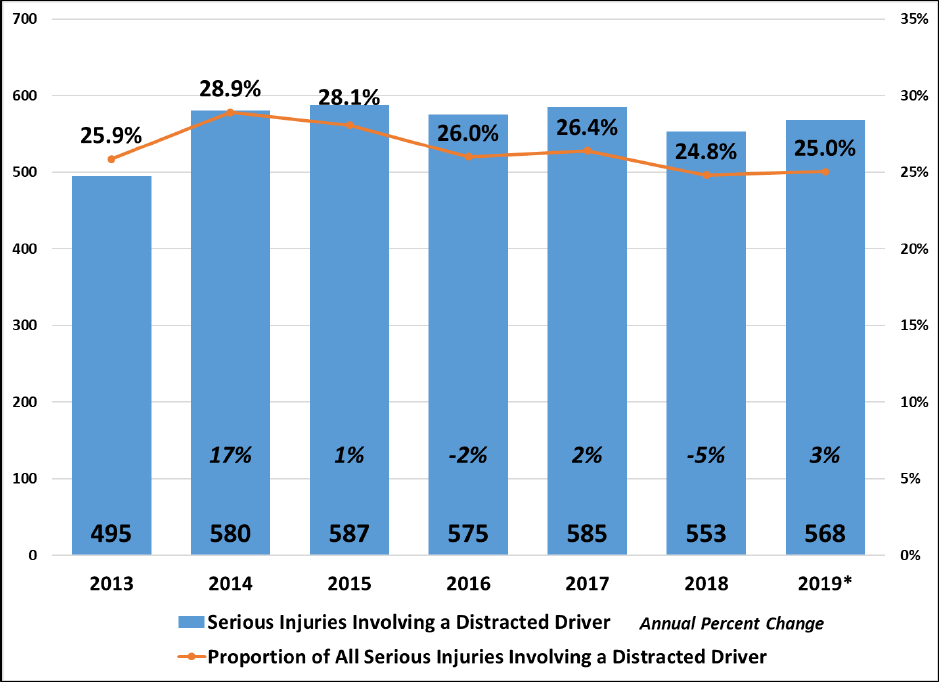
Serious injuries occur in both fatal crashes (when at least one person is deceased), and in non-
fatal crashes. Due to a coding change, distracted driver involved injuries are only available since
2013. There was no clear reduction in serious injuries after the new distracted driving law went
into effect (Figure 3). However, considering the limited historical information available for
distracted driver involved serious injuries, the highest single-year reduction (-5 percent) to date
occurred in 2018. The proportion of serious injuries involving a distracted driver remains
approximately one in four, before and after the law.
Figure 3: CRASHES, Serious Injuries Involving a Distracted Driver
Source: WSDOT Multi-Row Flat File *2019 preliminary counts provided by WSDOT.
- 9 -
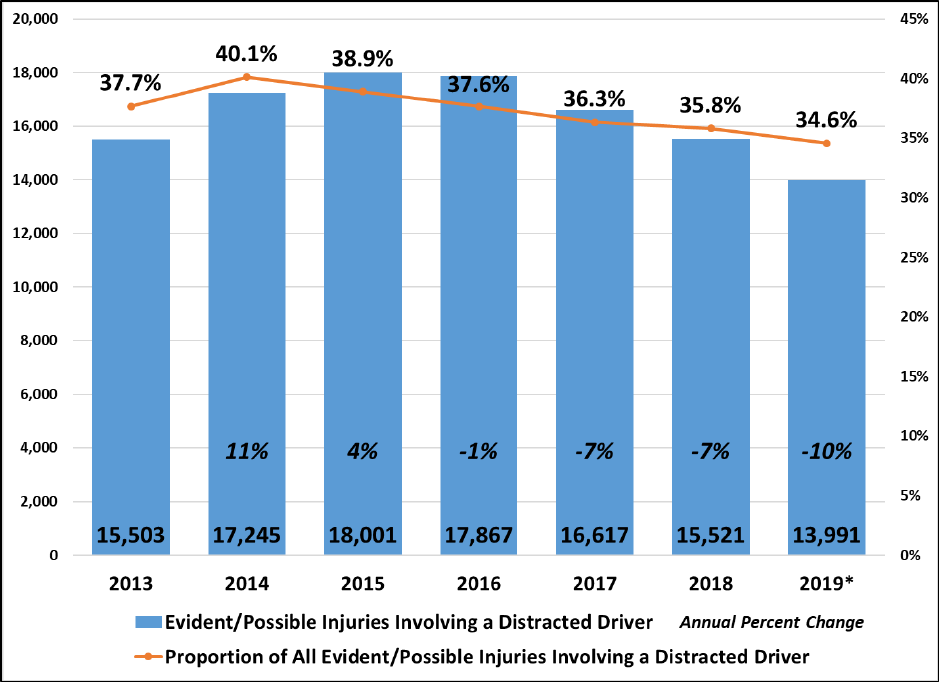
A greater decline, both in total numbers and proportion of injuries, has been achieved for
persons with evident and possible injuries from crashes involving distracted drivers (Figure 4).
These declines are consistent since 2015, so it is unclear what effect the law has had on overall
injuries. Despite consistent declines, one in three evident or possible injuries sustained in
crashes involved a distracted driver.
Figure 4: CRASHES, Evident and Possible Injuries Involving a Distracted Driver
Source: WSDOT Multi-Row Flat File *2019 preliminary counts provided by WSDOT.
Limitations Regarding Distracted Driving Crash Analysis
Analysts suspect that distraction involvement in crashes is generally under-reported, especially
distraction crashes related to cell phone use. Officers are reluctant to record specific
distractions contributing to the crash without defensible proof. Even witness accounts of driver
cell phone use in crash report narratives do not always mean that the driver is coded as being
distracted in the crash-contributing circumstances, which are used for crash analysis. When
distraction is coded, in more than two-thirds of the cases the distraction is coded as general
“inattention.” Starting in 2020 changes were made to the Washington Police Traffic Collision
Report to perhaps better capture distraction among all road users involved in crashes. Most
notably, inattention was removed to promote use of the more detailed distraction codes rather
than defaulting to general inattention in distraction-related crashes.
- 10 -
DISTRACTED DRIVING ENFORCEMENT
The National Highway Traffic Safety Administration conducts national media campaigns and
provides funding support to states for enforcement of distracted driving laws every April. These
high visibility enforcement campaigns are clearly shown in respect to distracted driving
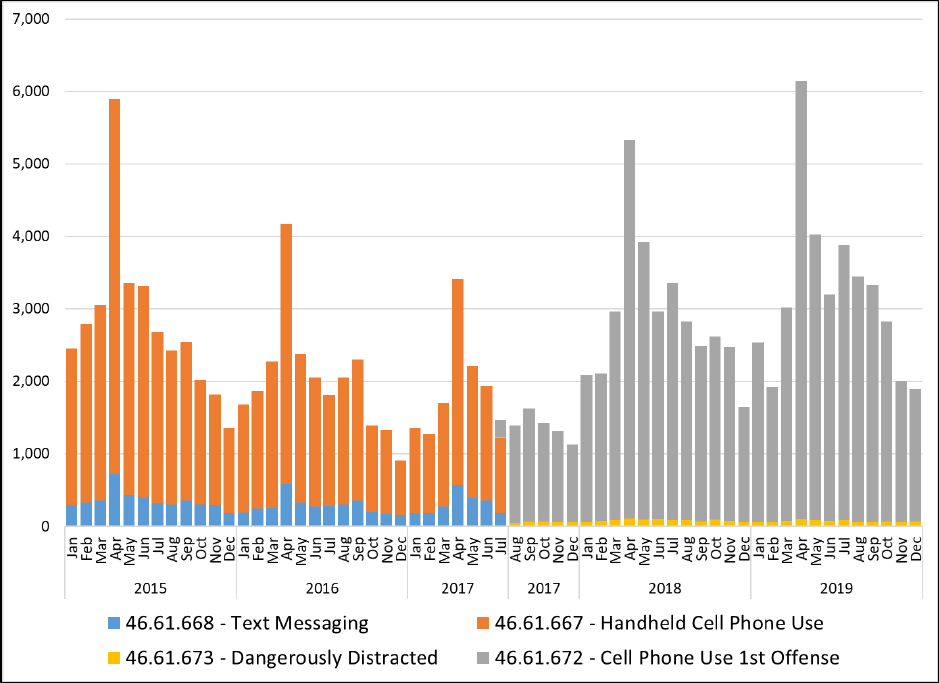
citations issued in Washington during the month of April (Figure 5). Prior to Washington’s new
distracted driving laws, citations issued during the month of April, while still high compared to
the other months, had been notably declining since 2015. The transition from the old laws to
the new laws occurred during the last half of 2017 during the enforcement education “grace
period.” The grace clearly expired in January 2018 when the number of citations nearly doubled
from the previous month.
While the seasonal pattern of distracted driving enforcement of the new laws is very similar to
enforcement of the old laws, the overall count of citations issued under the new law has
increased, indicating the new laws are easier to enforce. In addition, Washington law
enforcement issued more distracted driving citations during the April 2019 distracted driving
high visibility enforcement campaign than any other month since Washington’s first “texting”
law became a primary offense in 2010.
Figure 5. ENFORCEMENT, Distracted Driving Courts of Limited Jurisdiction Case Filings
- 11 -
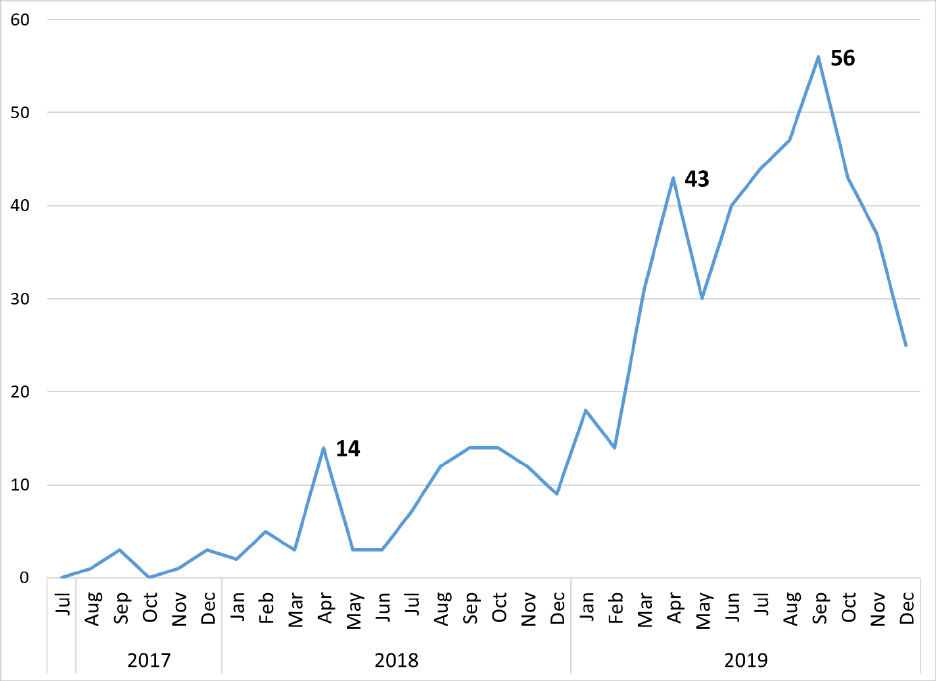
The new law increased the fine for a repeat cell phone offense within five years. A second and
subsequent offense increases the fine from $183 to $234. While there have been only a few
hundred citations issued for second and subsequent offenses, there is a sharp upward trend as
the population of first-time offenders grows. The first second offense citations were issued just
weeks after the law went into effect, indicating apprehension of chronic offenders (Figure 6).
Figure 6. ENFORCEMENT, Cell Phone Use 2
nd
+ Offense
Finally, the new law also made distracted driving citations available to insurance companies,
whereas before they were exempt from reporting. According to the Northwest Insurance
Council, when reviewing driver records during the application or renewal process, member
insurance companies are taking note of distracted driving citations and are increasing
premiums by varying amounts. As of September 2019 the highest increases were routinely
connected to distracted driving citations given with another offense, such as a Driving Under
the Influence (DUI) or in connection with a crash.
DISTRACTED DRIVING OBSERVATION SURVEY
Distracted driver observations were collected from 2016 to 2017 at randomly selected
intersections. In order to determine if the new laws would impact the observed driver distractions,
the data was collected following the exact same methods in 2018 (only at intersections). Beginning
with the 2019 survey as presented in this report, driver distraction was measured on all road types
- 12 -
across the state, creating a new baseline measure of observed driver distractions. Driver behavior
at intersections is different than driver behavior on other roadway types and scenarios, such as
interstate driving. The results from this survey are not comparable to the 2016-2018 survey
(WTSC, 2018), although both offer important insights on the effect of the new law.
Data was collected using an iPad application modified from the Washington State seat belt
observation application to collect distracted driver observations. The observations were conducted
for 20-minute periods at each site between the hours of 7 a.m. and 6 p.m. For each vehicle
surveyed at a given site, one member of the team observed oncoming vehicles and driver
distraction behavior and reported those observations verbally to the team’s recorder (facing the
observer), who entered that information into the data fields appearing on the iPad screen. A more
detailed description of the data collection process is described in Appendix A.
STATEWIDE RESULTS
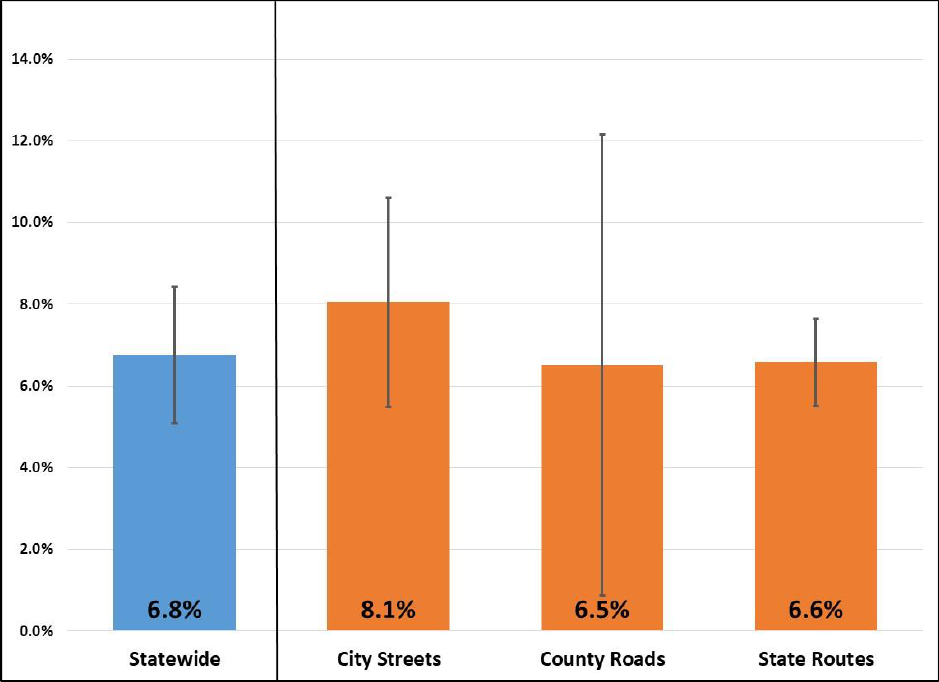
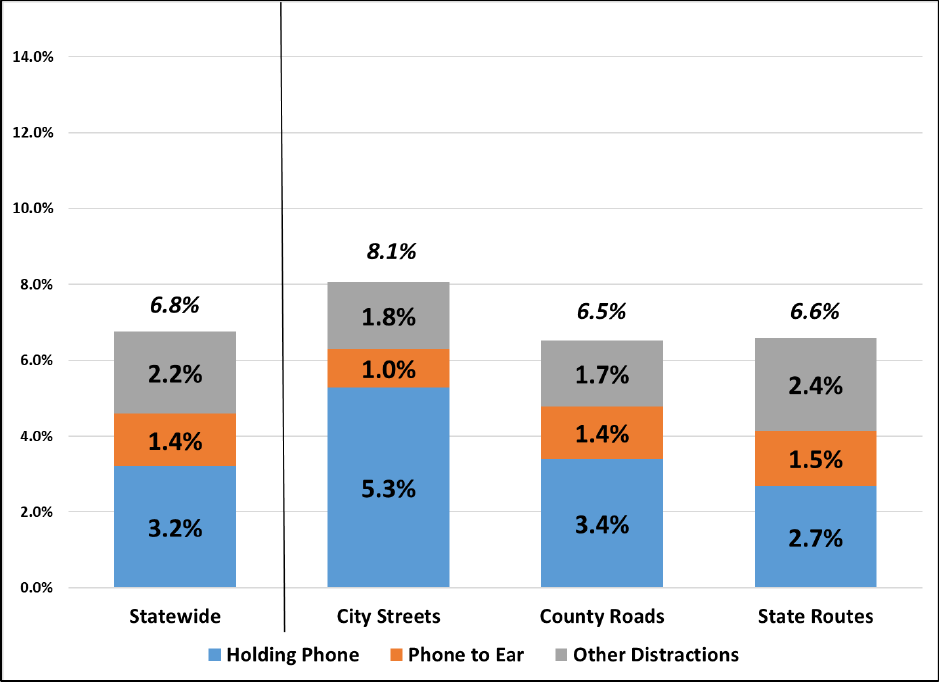
The statewide estimate of Washington’s driver distraction rate in 2019 was 6.8 percent. The
driver distraction rate was highest on city streets at 8.1 percent, followed by county roads at
6.5 percent and state routes at 6.6 percent (Figure 7). These differences are not statistically
significant; however, they align with the hypothesis that driver distractions are lower on roads
with higher posted speeds.
Figure 7. DRIVER DISTRACTION RATES, All Distractions
- 13 -
From 2016 to 2018 a similar distracted driver observation survey was conducted only at
intersections (WTSC, 2018). Although the results are not comparable to this survey, the
distracted driver rate on city streets (where most intersections from the previous survey reside)
was nearly identical to the 2018 survey conducted at intersections (8.1 versus 8.2 percent).
Cell phone use, especially holding a cell phone, is the most frequent source of driver
distractions. Approximately five percent of drivers on city streets are holding and engaging with
a cell phone. This frequency declines on county roads (3.4 percent) and state routes (2.7
percent). Figure 8 shows the frequency of types of distraction among all drivers. The figure on
the following page also shows type of distraction, but as a frequency among distracted drivers.
Figure 8. DRIVER DISTRACTION RATES, By Type of Distraction
- 14 -
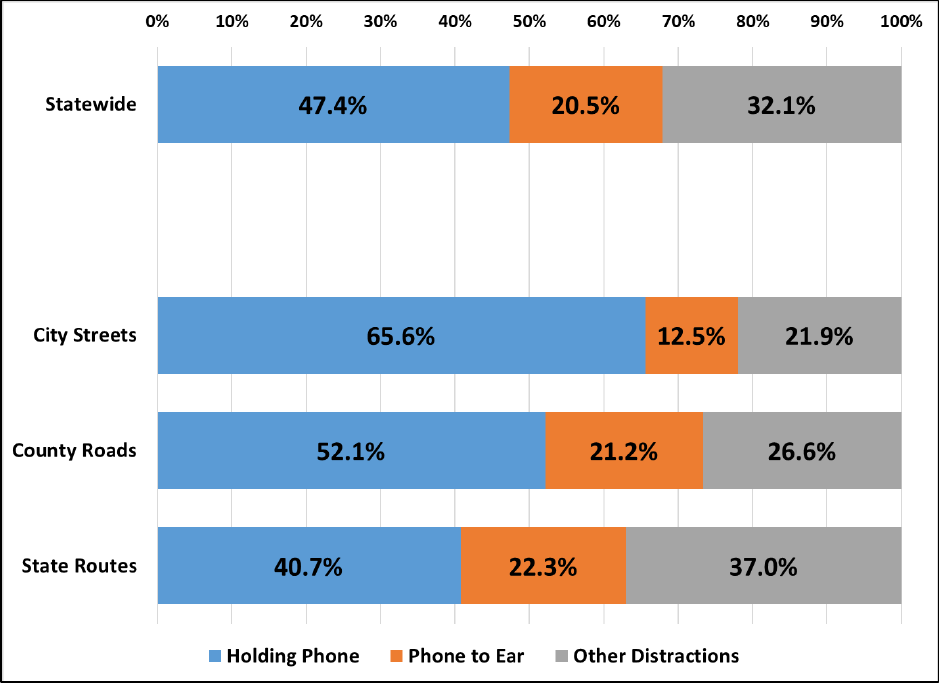
In 2018 cell phones were the source of just over half of driver distractions, which was down
from approximately three-quarters of all distractions from 2016 to 2017 (WTSC, 2018).
According to the new 2019 baseline survey, cell phone-related distractions comprise
approximately two-thirds of all driver distractions—47.4 percent holding phones and 20.5
percent with the phone to ear (Figure 9).
Figure 9. SOURCE OF DRIVER DISTRACTION, Proportion of All Distractions
City streets have higher rates of hand-held cell phone use, possibly due to lower posted speeds
and more stops, such as at traffic lights. However, city and residential areas have lower posted
speeds for good reason; these are the areas frequented by pedestrians, bicyclists, transit, and
other road users. This level of multi-modal interaction requires driver engagement. Yet driver
distraction, especially hand-held cell phone use, is higher on city streets. As speed limits
increase from city streets, county roads, and state routes, hand-held cell phone use decreases
(Figure 9). Interestingly, the rate of cell phone to ear distractions is much lower on city streets,
possibly due to the increased risk of law enforcement apprehension at lower speeds.
- 15 -
COUNTY RESULTS
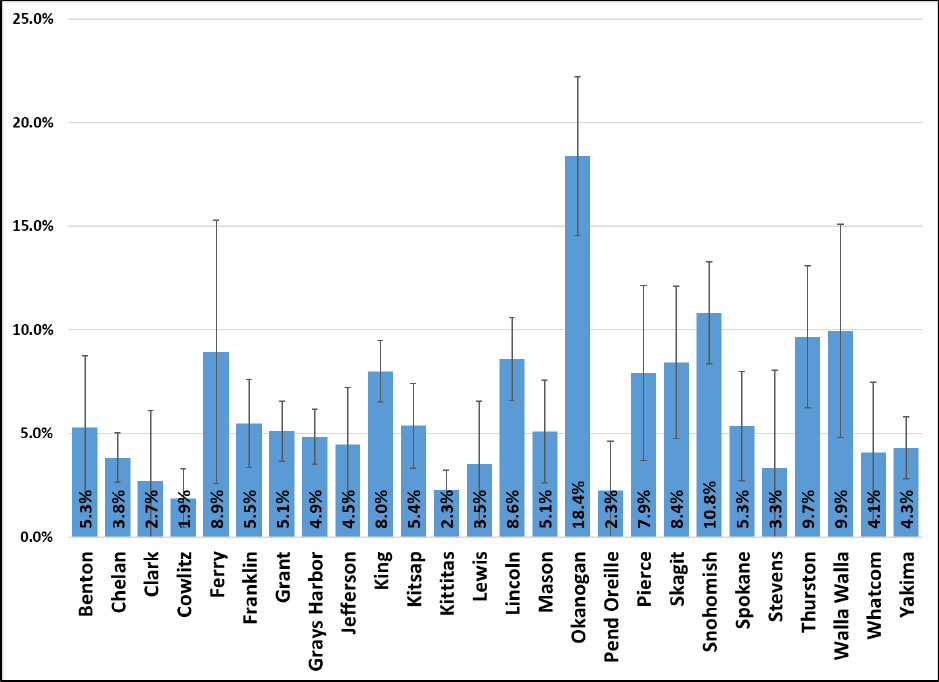
Distracted driver rates varied widely among sampled counties (Figure 10). According to the
survey, Okanogan county had the highest rate driver distraction, nearly one in five drivers.
Cowlitz county had the lowest rate of distracted drivers at just 1.9 percent.
Figure 10. DRIVER DISTRACTION RATES, By Sampled County
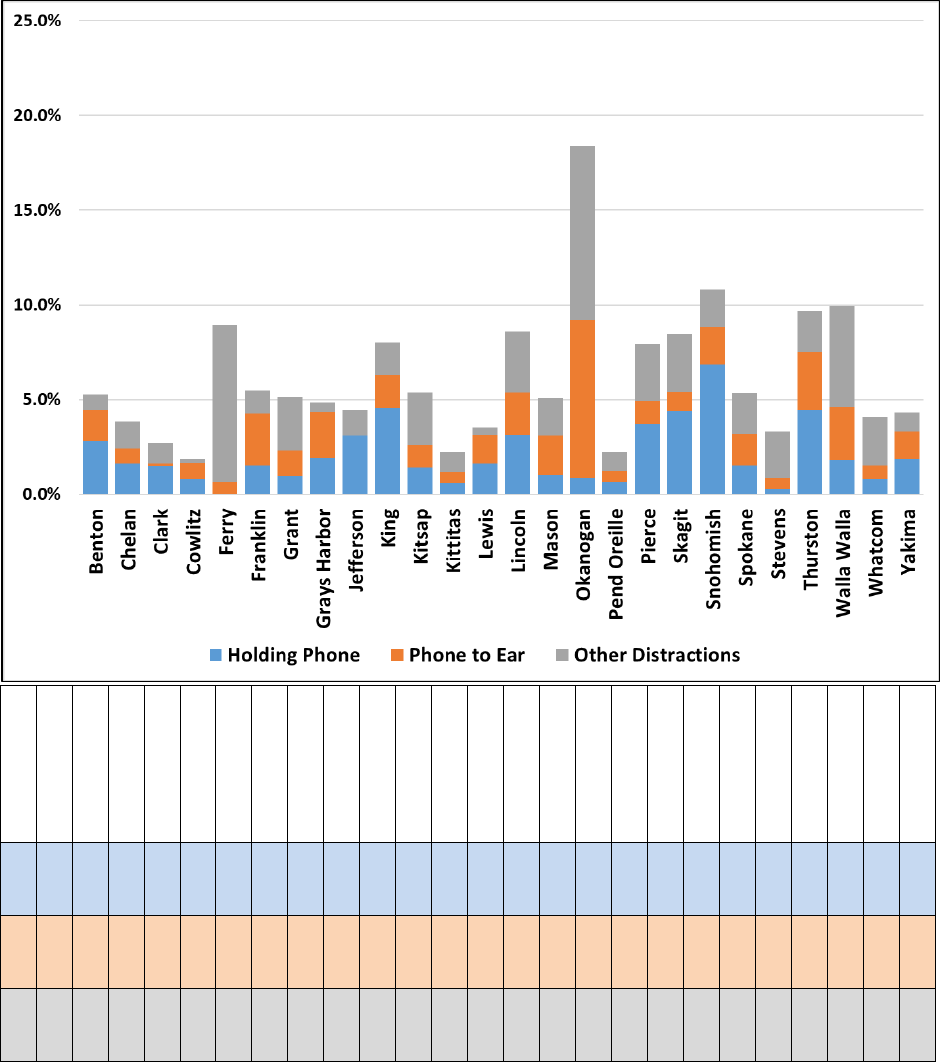
The type of distraction also varied greatly by county (Figure 11). Although Okanogan county had
the highest distracted driver rate, the proportion of drivers engaging in holding a cell phone is
low compared to other counties. However, the frequency of driver holding the phone to ear is
highest in Okanogan county, as is other distractions not cell phone related. Nearly all
distractions in Cowlitz county (the county with the lowest overall distracted driver rate) is
attributed to cell phone use. The results in Figure 11 indicate that cell phone related
distractions are more common in more urban counties, whereas other distractions not related
to cell phone use is higher in more rural counties (most notably Ferry, Grant, Lincoln, Mason,
Okanogan, Stevens, and Walla Walla).
- 16 -
Figure 11. DRIVER DISTRACTION RATES, By County, Type of Distraction
Benton
Chelan
Clark
Cowlitz
Ferry
Franklin
Grant
Grays Harbor
Jefferson
King
Kitsap
Kittitas
Lewis
Lincoln
Mason
Okanogan
Pend Oreille
Pierce
Skagit
Snohomish
Spokane
Stevens
Thurston
Walla Walla
Whatcom
Yakima
2.8%
1.6%
1.5%
0.8%
0.0%
1.5%
1.0%
1.9%
3.1%
4.6%
1.4%
0.6%
1.6%
3.2%
1.0%
0.9%
0.7%
3.7%
4.4%
6.9%
1.5%
0.3%
4.5%
1.8%
0.8%
1.9%
1.7%
0.8%
0.1%
0.8%
0.7%
2.8%
1.3%
2.4%
0.0%
1.7%
1.2%
0.5%
1.5%
2.2%
2.1%
8.3%
0.6%
1.2%
1.0%
2.0%
1.7%
0.6%
3.0%
2.8%
0.7%
1.5%
0.8%
1.4%
1.1%
0.2%
8.3%
1.2%
2.8%
0.5%
1.4%
1.7%
2.8%
1.1%
0.4%
3.2%
2.0%
9.2%
1.0%
3.0%
3.0%
2.0%
2.1%
2.5%
2.2%
5.3%
2.6%
1.0%
The figure on the following page also shows type of distraction, but as a frequency among
distracted drivers.
- 17 -
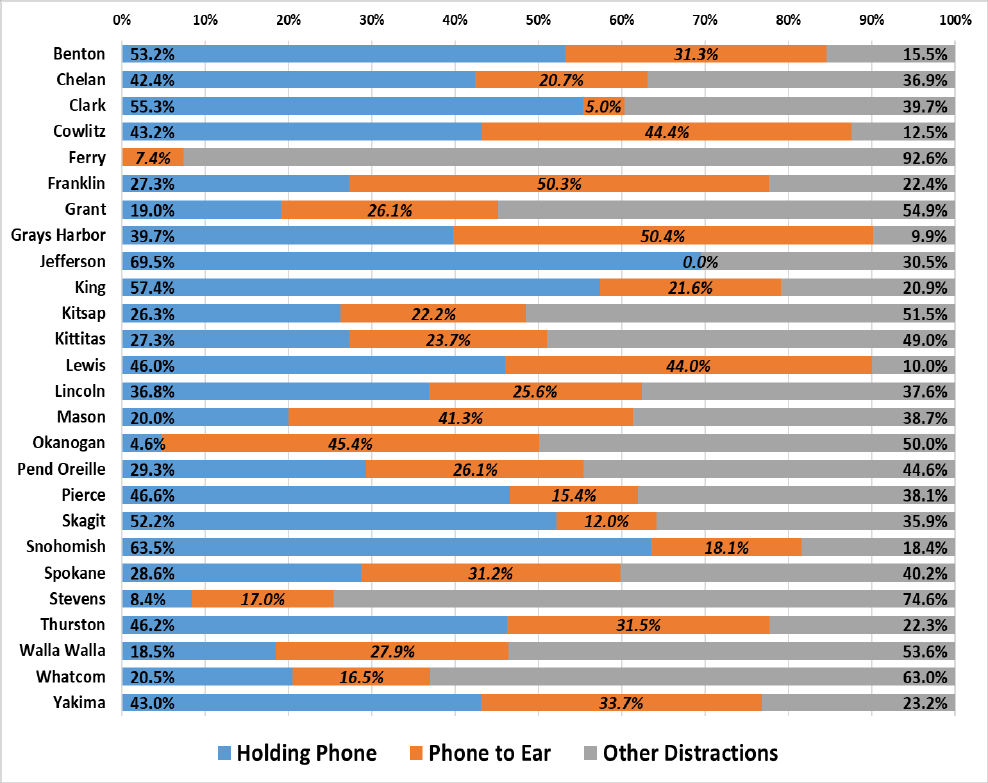
Among distracted drivers, the source of distraction varies among counties (Figure 12). Several
counties have distracted driving rates that are more than 80 percent attributable to either
holding a cell phone or holding the cell phone to ear, i.e. four out of every five distracted
drivers. These counties are Benton, Cowlitz, Grays Harbor, Lewis, and Snohomish. Franklin,
King, Thurston, and Yakima counties have distracted driving rates that are more than 75
percent attributable to cell phone use, or three out of every four distracted drivers. As noted
earlier, more rural counties have a distraction rate more attributable to the “other distractions”
(see Ferry, Stevens, and Whatcom counties).
Figure 12. SOURCE OF DRIVER DISTRACTION, By County, Proportion of All Distractions
- 18 -
DISCUSSION
This report is based on Washington’s statewide observation survey of distracted driving,
representing benchmark measures of estimated driver distraction. A similar study was
conducted in 2013 and 2014 by the Harborview Injury Prevention and Research Center,
collecting information in King, Spokane, and Whatcom Counties. Despite the differences in
these studies, the results were similar; the majority of distracted drivers are using a cell phone.
These efforts to measure the frequency of distracted driving in Washington are critical due to
significant data limitations from other sources, such as crash data.
On January 1, 2006 the Washington State Department of Transportation (WSDOT) and the
Washington State Patrol implemented Legislature-enacted changes to the state’s Police Traffic
Collision Report, adding 12 new and specific distraction codes to the collision report form. This
change increased the frequency of crash investigators’ reporting of driver distraction from 6.1
percent of crashes in 2005 to 11.1 percent in 2006. Through 2012, that proportion remained fairly
steady, after which an even larger increase occurred in 2013 as a result of administrative changes
to collision coding practices at the WSDOT. When analyzing distraction involvement in crashes
from WSDOT’s statewide collision database, the baseline benchmark is now year 2013 as previous
years are not comparable.
In addition to collision data challenges, there are good reasons to believe that police investigators
under-report the involvement of driver distraction in crashes. One important reason is the
difficulty of gaining access to driver cell phone records during the investigation of crashes. Even
when police suspect that cell phone-based distraction has played a role in a crash, unless they
are able to establish probable cause (e.g., through witness statements or other evidence) they
will be unable to obtain a warrant for a driver’s cell phone records.
Considering these limitations along with other data sources, this study provides important
information regarding the nature of distracted driving in Washington State. The distracted
driving laws implemented in 2017 seem to have had immediate effect on driver behavior,
although further evaluation is required. It remains to be seen further effects the enhanced law
and other traffic safety measures have on protecting the lives of Washington road users.

- 19 -
REFERENCES
AAA Foundation for Traffic Safety (2018). 2017 Traffic Safety Culture Index.
http://aaafoundation.org/2017-traffic-safety-culture-index/
CDC, Office of Disease Prevention and Health Promotion. Healthy People 2020 Topics and
Objectives, Injury and Violence Prevention. https://www.healthypeople.gov/2020/topics-
objectives/topic/injury-and-violence-prevention
King County Target Zero Task Force. June 2018. Survey USA Market Research Study #24067.
http://www.surveyusa.com/client/PollReport.aspx?g=85ba5081-1100-4f93-9953-ac3f1ee3d95e
Washington Traffic Safety Commission. November 2018. Distracted Driving in Washington State,
2016-2018: Final Results from the Annual Observation Surveys. https://wtsc.wa.gov/research-
data/traffic-safety-reports/
Washington Traffic Safety Commission. September 2019. Positive Traffic Safety Culture
Quantitative Research Study. http://wtsc.wa.gov/download/11394/
- 20 -
APPENDIX A: Distracted Driver Observation Survey Data Collection
Data was collected at each site selected for Washington’s annual seat belt use observation
survey. Sites included strategic viewing locations on city streets, county roads, and state/U.S.
routes, representing a variety of roadway types, conditions, posted speeds, and traffic flow.
Each pre-selected site was observed by a two-person team for a 20-minute period between the
hours of 7 a.m. and 6 p.m. during the month of June. Teams collected driver behavior data on
passenger vehicles and commercial vehicles with a gross vehicle weight of 10,000 pounds or
less (such as a pizza delivery driver), including cars, vans, pickups, and SUVs.
Each team was comprised of two positions: an Observer and a Recorder. Teams could alternate
positions when moving between sites, but could not change positions when in the middle of a
site observation. The team proceeded to the location per the site data sheet and observed the
predetermined traffic flow. If the team reached a site that included multiple lanes eligible for
observation then traffic was observed for a few minutes in order to make an assessment of how
many lanes could accurately be observed.
During data collection, the Recorder was positioned either in front of or parallel to the Observer
so they could best hear the observations as they were called out. The Observer called out the
initial observation to the Recorder who entered the data in the iPad survey application. In
addition, field training revealed that the presence of the observers obviously looking inside
vehicles was in and of itself causing distraction. Having the observer and recorder facing each
other made it appear that they were in conversation rather than observing vehicles. This
technique significantly reduced the amount of driver attention diverted to the observer team.
Data was only collected on drivers. Data collected on each driver included whether the driver
had no distraction, cell phone to ear, holding/manipulating phone, or other distraction (such as
eating, radio, and pets). Drinking a beverage or smoking did NOT count as distractions so long
as the driver was not clearly distracted otherwise. Only the initial behavior at the observation
point was recorded. If the driver changed behavior while being observed, only the initial
observation was recorded.
Quality Control (QC) Monitors made unannounced visits to at least five percent of the total
survey sites. During these visits, the QC Monitor first evaluated the data collector team’s
performance from a distance (if possible), and then observed from beside the team to monitor
data recording. The QC Monitor ensured that the data collector team was following all survey
protocols including: being at the assigned sites, making accurate observations, and accurately
entering the data into the iPad survey app. For every visit, the QC Monitor prepared a site
report indicating data collector team names, date and time of observation, site ID, photo of
team in action, and any problems with data collection site locations and data collector team
performance.
For more information regarding the observation survey sites, methods, weights, or analysis,
please contact the Research and Data Division at the WTSC.
