
Assessing the Adequacy and Means
of Funding Services for Students
with Disabilities in Wyoming
Prepared by District Management Group
Under subcontract with Picus Odden & Associates
Prepared for the Wyoming Select Committee
on School Finance Recalibration
FINAL REPORT – December 1, 2020

District Management Group | Helping Schools and Students Thrive | www.dmgroupK12.com
Table of Contents
1. Introduction ...................................................................................................... 1
1a. Executive Summary .................................................................................................... 3
1b. Methodology ............................................................................................................. 9
1c. Wyoming Special Education Context & Background ................................................... 16
2. Improving Special Education Teaching & Learning ........................................... 20
2a. Commendations ....................................................................................................... 20
2b. Best Practices Framework ......................................................................................... 33
2c. Opportunities ........................................................................................................... 37
Opportunity #1: Strengthen Tier 1 classroom instruction by increasing the capacity of general
education teachers to support all learners through a combination of a redesigned approach to
high-quality instructional coaching (instructional facilitators), master teachers and model
classrooms. ......................................................................................................................................37
Opportunity #2: Clarify and expand the statewide guidance for Multi-Tiered Systems of Support
(MTSS) to include training, support, and real-life applications for school districts ........................46
Opportunity #3. Ensure that students with academic needs receive best practice intervention
including extra instructional time provided by content strong staff ...............................................53
Opportunity #4: Refine the role of paraprofessionals to focus on health, safety, behavioral, and
severe needs, rather than academic support .................................................................................61
Opportunity #5. Expand the MTSS approach to providing social, emotional, and behavioral
supports for students ......................................................................................................................71
Opportunity #6. Consider statewide strategies for recruiting, retaining, and training highly
qualified special education staff......................................................................................................82
Opportunity #7. Reduce the administrative duties (e.g. paperwork, meetings) for special
education teachers through process mapping, utilizing the case management model, and
allowing them to play to their strengths .........................................................................................90
Opportunity #8: Take a regional approach in small districts to improve services for students with
more severe needs and to providing intensive behavioral supports ..............................................99
3. Assessing Special Education Funding ............................................................. 111
3a. Overview, Strengths, & Challenges of the Current Funding Model ............................ 111
3b. Overview of Alternative Special Education Funding Models ..................................... 125
3c. Recommendations for the Wyoming Funding Model ................................................ 141
Recommendation #1: Place greater emphasis on how dollars are spent rather than just how
much funding is provided to special education............................................................................ 141
Recommendation #2: Consider encouraging the use of general education staff to support
students with disabilities through the reimbursement model .................................................... 143

District Management Group | Helping Schools and Students Thrive | www.dmgroupK12.com
Recommendation #3: Consider establishing checks and balance to limit the financial incentive of
over-identification of students with disabilities. .......................................................................... 145
Recommendation #4: Separate high need, high cost students into their own reimbursement plan
with a different cap and process for more timely reimbursement .............................................. 145
Recommendation #5: Consider establishing greater checks & balances for costs associated with
non-high needs students in the reimbursement model .............................................................. 148
4. Reviewing Special Education Guidance and Practice ...................................... 151
4a. Review of Wyoming Guidance for Implementation of IDEA, Part B ........................... 152
4b. Recommendations: ................................................................................................. 157
Recommendation #1: Revise state guidance on IDEA, Part B excess cost and supplement not
supplant requirements to reflect the full flexibility intended by the federal regulations ........... 157
Recommendation #2: Update State monitoring tools to reflect new guidance ......................... 157
5. Conclusion & Next Steps ............................................................................... 158
6. Appendices ................................................................................................... 161
6a. Appendix A - DMGroup Sample Interview Questions................................................ 161
6b. Appendix B – DMGroup Schedule of Meetings with WDE & LSO ............................... 164
6c. Appendix C - Sample Schedule for Large District Visit ............................................... 166
6d. Appendix D – Sample Schedule for Small District Visit .............................................. 168
6e. Appendix E - WDE Special Education Data Request .................................................. 170
6f. Appendix F - Federal Education Group Report on IDEA, Part B Spending and Related
Fiscal Rules Implementation in the State of Wyoming ................................................... 173
6g. Appendix G - Chart of Activities Districts Can Support with IDEA, Part B Funds ......... 186
6h. Appendix H - Resources on the use of IDEA, Part B Funds from Delaware Department of
Education .................................................................................................................... 192
6i. Appendix I - Resources on the use of IDEA, Part B Funds from Mississippi Department of
Education .................................................................................................................... 193
6j. Appendix J – References .......................................................................................... 194
6k. Appendix K – Maintenance of Effort (MOE) for IDEA Funds ...................................... 203

District Management Group | Helping Schools and Students Thrive | www.dmgroupK12.com
1
1. Introduction
In 2020, the Wyoming Legislature contracted with Picus Odden & Associates to
recalibrate the state’s school funding model. In this process, Picus Odden &
Associates reviewed the Wyoming Education Resource Block Grant Model and
used their Evidence-Based (EB) Model to assess the adequate level of school
funding in Wyoming, while keeping in mind the most cost-effective options to
provide the necessary basket of goods and services.
Special education, however, is not part of the Block Grant but districts are
reimbursed 100 percent of their allowable costs. Thus, as part of the overall
recalibration effort, Picus Odden & Associates contracted with District
Management Group (DMGroup) to conduct a review of special education
services, policies, and funding across Wyoming, in short to “recalibrate” the
state’s approach to funding special education services. Throughout the spring
and summer of 2020, DMGroup sought to gain a deep and thorough
understanding of special education services and funding across Wyoming.
The goals of this special education review are to:
1. Identify opportunities to raise achievement for students with
disabilities, i.e., to identify best practices in serving students with
disabilities
2. Look for opportunities to make supporting students with disabilities
easier and more effective for districts and teachers
3. Find ways to achieve goals 1 and 2 in the most cost-effective manner
4. Review regulations and policies that either support or inhibit best
practices
5. Consider alternatives to the current special education funding model.
In order to conduct this work, DMGroup collected and analyzed extensive
quantitative and qualitative data, met with hundreds of stakeholders across the
state, and reviewed services provided to students with disabilities in a number of
different ways.

District Management Group | Helping Schools and Students Thrive | www.dmgroupK12.com
2
This report outlines the findings from DMGroup’s special education review in
Wyoming. The recommendations are well aligned with the EB Model developed
by Picus Odden & Associates.
The findings are broken out into three major sections:
● Improving Special Education Teaching & Learning
● Assessing Special Education Funding
● Reviewing Special Education Guidance and Practice
All findings in this report tie back to goals of the special education review, with
the intention of raising achievement for students with disabilities first, and
doing so in a cost-effective manner.

District Management Group | Helping Schools and Students Thrive | www.dmgroupK12.com
3
1a. Executive Summary
At a high level, DMGroup’s key takeaways from this study can be summarized as
follows:
Academic Achievement
● To raise achievement for students with special needs, changing how
dollars are spent will be more important than focusing how many dollars
are spent.
● To improve outcomes for students with disabilities, improving general
education core instruction, general education provided intervention, and
classroom based social-emotional practices are key. General education
and effective inclusion are more than half the solution.
Spending and Funding
● These practices – core instruction, extra help for struggling students and
social/emotional supports – are fully funded in the EB model, can be
provided before a student is identified as having a disability, and are more
cost-effective than current approaches to providing special education
services.
● The additional spending for students with disabilities is higher in
Wyoming than the national average, both in absolute terms and in
comparison to general education spending. This higher spending has not
led to higher levels of achievement. The higher spending is driven both by
factors that contribute to higher general education spending: the small,
rural nature of many districts and higher than national average staff
salaries, and by an embrace of some high cost, but less effective strategies.
● Overall, Wyoming’s reimbursement model for special education is
ensuring students with disabilities receive the services schools and
districts believe are appropriate. Despite incentives that could increase the
number of students identified for a disability and the possibility of rapid
increases in spending year over year, district leaders have balanced the
needs of students with fiscal responsibility, based on their understanding
of best practices. However, updates to this model can ensure that most

District Management Group | Helping Schools and Students Thrive | www.dmgroupK12.com
4
dollars are used for best practices and in a cost-effective manner. This
would raise achievement and reduce costs over time.
● There is a misunderstanding concerning the acceptable uses of
Individuals with Disabilities Act (IDEA), Part B dollars that may
unintentionally discourage cost effective best practices for serving
students with disabilities.
Small District Challenges
● Small, rural schools and districts face unique challenges to serving
students with special needs and would benefit from creating regional
approaches to these challenges which could both provide better services
for students and at a lower cost.
● Improving the recruitment, retention, and training of special educators as
well as content expert teachers with special education training will help
schools and districts improve services and reduce the long-term costs. The
national shortage of special educators has led to an over reliance on
paraprofessionals, which is not optimal for students or the budget. This is
true in all districts, but more acute in small districts.
Below is a more detailed summary of DMGroup’s findings and
recommendations, by section in the report.
Improving Special Education Teaching & Learning
There were ten commendations and eight opportunities identified for Wyoming
to improve special education teaching and learning.
Commendations
1. Staff and leaders across Wyoming were passionate, dedicated, and
committed to meeting the needs of all students and providing high
quality services.
2. Many districts had a robust process for identifying students with
disabilities, through a data-driven Behavior Intervention Team (BIT) or
Response to Intervention (RTI) process.

District Management Group | Helping Schools and Students Thrive | www.dmgroupK12.com
5
3. Schools and districts wrote Individualized Education Program (IEPs) plans
and provided services based on their perceptions of student need rather
than available resources.
4. Most districts were committed to providing a wide continuum of services
to meet the needs of all students within their district.
5. There was a statewide focus on serving students in the least restrictive
environment that is embraced by district administrators and staff.
6. Paraprofessionals were highly motivated, and, in many districts, were
used appropriately to support students with severe needs or to meet health
and safety needs. While some aspects of the use of paraprofessionals was
commendable, there was also an opportunity identified to refine their role
to the benefit of students and the budget. See opportunity 4 for more
information.
7. Many districts had strong transition services for students with more
severe disabilities aging out of the school district.
8. Staff members across districts had extensive opportunities to participate
in traditional professional development opportunities and apply the
learning in their classrooms.
9. Special education caseloads - reinforced by the statewide staffing
guidelines - were manageable and may support staff retention.
10. Districts took seriously being fiscally responsible with their special
education spending, given their understanding of best practices.
Opportunities for Consideration
1. Strengthen Tier 1 classroom instruction by increasing the capacity of
general education teachers to support all learners through a combination
of a redesigned approach to high-quality instructional coaching
(instructional facilitators), master teachers and model classrooms.
2. Clarify and expand the statewide guidance for Multi-Tiered Systems of
Support (MTSS) to include training, support, and real-life applications for
school districts.
3. Ensure that special education students with academic needs receive best
practice intervention including extra instructional time with content
strong staff.

District Management Group | Helping Schools and Students Thrive | www.dmgroupK12.com
6
4. Refine the role of paraprofessionals to focus on health, safety, behavioral,
and severe needs, rather than academic support for students with mild to
moderate needs.
5. Expand the MTSS approach to providing social, emotional, and behavioral
supports for students.
6. Consider statewide strategies for recruiting, retaining, and training highly
qualified special education staff.
7. Reduce the administrative duties (e.g. paperwork, meetings) for special
education teachers through process mapping, utilizing the case
management model, and allowing special education teachers to play to
their strengths.
8. Take a regional approach in small districts to improving services for
students with more severe needs and to providing intensive behavioral
supports.
Assessing Special Education Funding
There were three strengths and five challenges to the existing funding model.
There are five recommendations for improving special education funding
across Wyoming.
Strengths
1. Wyoming’s reimbursement model provides districts the freedom to
provide services as the IEP team deems appropriate. That said, our report
has identified multiple ways more effective services can be provided and
in most cases at reduced costs.
2. Decision making for spending lives closest to the students, at the district,
principal, and practitioner level.
3. Wyoming culture, coupled with the cap on special education spending,
has encouraged districts to be fiscally responsible with special education
dollars given their understanding of best practices. Because of this, school
districts have not over-identified students with disabilities and have not
substantially increased spending year-over-year.
Challenges

District Management Group | Helping Schools and Students Thrive | www.dmgroupK12.com
7
1. Wyoming’s average additional per pupil expenditures for students with
disabilities was higher than the national average, both in absolute terms
and relative to general education spending, but has not led to above
average outcomes.
2. The reimbursement model has unintentionally discouraged general
education support for students with disabilities, even though such
support is a best practice for closing the achievement gap and fiscal
efficiency. (The Wyoming funding model includes multiple mechanisms
that should mitigate this shortcoming, but unfortunately, these
mechanisms have not had the desired effect.)
3. The reimbursement model creates short term financial challenges for
districts when new students with severe, high cost needs, move into a
district. While fund balances typically covered these costs until
reimbursement is provided the following year, it creates some concern at
the district level and creates a sense that special education spending is
hard to manage tightly.
4. There are few incentives, if any, to encourage deploying resources toward
more cost-effective best practices.
5. Wyoming’s model for special education funding provides few incentives
for districts or teachers to be fiscally or educationally creative, potentially
leading to over-identification or over-spending in special education in the
future.
Recommendations
1. Place greater emphasis on how dollars are spent (on effective best
practices) rather than just how much funding is provided to special
education.
2. Consider encouraging the use of general education staff (core teachers
and tutors/interventionists) to support students with disabilities through
the reimbursement model.
3. Consider establishing checks and balances to limit the financial incentive
of over-identification of students with disabilities.
4. Separate high need, high cost students into their own reimbursement plan
with a different cap and process for more timely reimbursement and a
greater sense of control over spending at the district level.

District Management Group | Helping Schools and Students Thrive | www.dmgroupK12.com
8
5. Consider establishing greater checks and balances for costs associated
with non-high needs students in the reimbursement model.
Reviewing Special Education Guidance and Practice
There are two recommendations for improving special education guidance and
practices.
1. Revise state guidance on IDEA, Part B excess cost and supplement not
supplant requirements to reflect the full flexibility intended by the
federal regulations.
2. Update State monitoring tools to reflect the new guidance.

District Management Group | Helping Schools and Students Thrive | www.dmgroupK12.com
9
1b. Methodology
In the review of special education services, guidance, and funding across the
state of Wyoming, District Management Group and their partners collected and
analyzed extensive data and research.
DMGroup collected data from a number of different sources to understand how
students are identified and services provided. The section below outlines the
process for collecting and analyzing data.
Focus Groups, Interviews, and Classroom Observations:
DMGroup conducted over 150 focus groups and interviews with over 450 leaders
and staff across Wyoming. DMGroup used these interviews and focus groups to
understand how the special education system – both identifying students who
need an IEP and deliver services – works in districts and across the state. A
sample set of interview questions for state leaders, district leaders, and school
staff are included in Appendix A.
At the state level, DMGroup conducted focus groups and interviews with
Wyoming Department of Education (WDE) and Legislative Service Office (LSO)
employees, and members of the Wyoming Association of Special Education
Administrators, Wyoming School Boards Association and Wyoming Education
Association over January 22-23, 2020. At WDE, DMGroup spoke with leaders
including the State Superintendent, Chief of Staff, Chief Academic Officer, and
Division Director for Special Education. DMGroup also spoke with members of
the academic, finance, and data teams at WDE. DMGroup’s schedule of
interviews and focus groups are found in Appendix B.
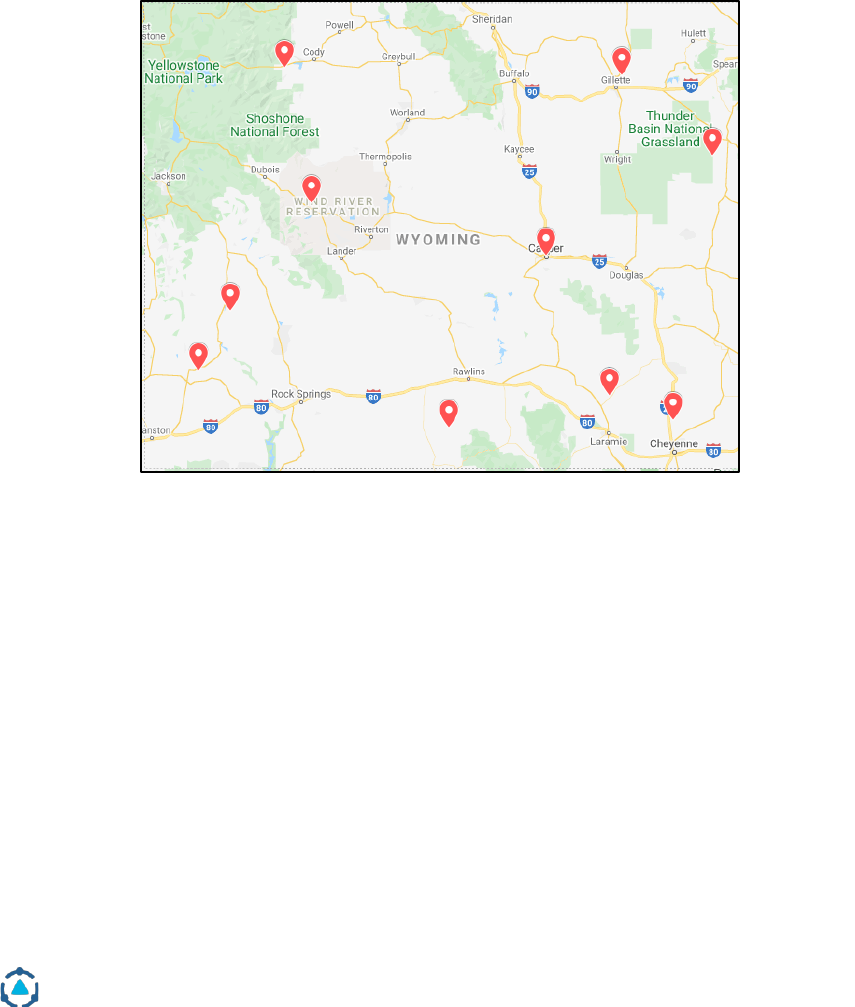
Through conversations with state leaders, DMGroup established a list of ten
school districts across Wyoming to visit for focus groups, interviews, and
classroom observations. This list was a representative sample of size, geographic
location, and services for students with disabilities.
Below is the list of ten districts and their location in Wyoming:
● Albany County School District 1: Laramie, WY*
● Campbell County School District 1: Gillette, WY
● Carbon County School District 1: Rawlins, WY*
District Management Group | Helping Schools and Students Thrive | www.dmgroupK12.com
10
● Fremont County School District 6: Pavilion, WY*
● Laramie County School District 1: Cheyenne, WY*
● Lincoln County School District 1: Diamondville, WY
● Natrona County School District 1: Casper, WY
● Park County School District 6: Cody, WY*
● Sublette County School District 9: Big Piney, WY
● Weston County School District 1: Newcastle, WY
*Indicates that visit was done virtually, due to COVID-19 pandemic.
Note: Locations in image are approximate.
Five districts (Campbell, Lincoln, Natrona, Sublette, and Weston) were visited
over the weeks of March 2-6 and March 9-13, 2020. During these visits, DMGroup
team members spoke with district leaders and school-based staff to hear
perspectives on special education services at the district level. Below is a list of
typical roles that DMGroup staff spoke with in their district visits:
● Superintendent
● Assistant Superintendent / Chief Academic Officer
● Business Manager / Chief Financial Officer

District Management Group | Helping Schools and Students Thrive | www.dmgroupK12.com
11
● Special Education Director
● Principals
● Mild to Moderate Special Education Teachers
● Severe Needs Special Education Teachers
● General Education Teachers
● School Psychologists
● School Social Workers
● Speech & Language Pathologists
● Occupational Therapists
● Physical Therapists
● Interventionists/Tutors/Specialists
● Paraprofessionals
Additionally, DMGroup staff visited a range of classrooms at elementary,
middle, and high schools that support students with disabilities. This included
inclusive settings, resource rooms, and self-contained programs to see services
in action.
A sample district visit schedule for a large district (Campbell, Laramie, Natrona)
and medium-to-small district (all others) are found in Appendix C & Appendix D.
Interviews and focus groups for the other five districts (Albany, Carbon,
Fremont, Laramie, and Park) were conducted virtually, as the COVID-19
pandemic halted in-person classes for students and travel across the country.
Between April 20 and May 22, 2020, DMGroup staff conducted virtual interviews
and focus groups with the same set of district leaders and school staff members.
DMGroup was unable to visit classrooms in these districts.
DMGroup staff reviewed and synthesized notes from these focus groups based
on district and statewide themes. Quotes and anecdotes from these interviews
and focus groups will appear throughout the special education teaching and
learning and special education funding sections of this report. All quotes and
anecdotes are anonymized to protect the identity of the district and staff
member who may have shared this information.

District Management Group | Helping Schools and Students Thrive | www.dmgroupK12.com
12
Schedule Sharing:
In addition to focus groups and interviews, DMGroup asked special education
staff from all 48 districts to share a typical week’s schedule; DMGroup used their
own proprietary schedule sharing software, dmPlanning, for this activity. This
activity asked staff to log into DMGroup’s software and provide a fine-grained
look at how they spent their time, both in direct service with students and on
other responsibilities. Due to the COVID-19 pandemic, schedule sharing across
the state was delayed from the weeks of March 30 - April 17 to the weeks of May
11-27. Staff were provided detailed instructions on how to enter data on what a
typical schedule looks like in a brick-and-mortar school, and were provided the
opportunity to share feedback on the following two open ended questions:
1. What kinds of activities tend to get in the way of being able to stick to your
typical schedule?
2. What is one thing you would change about your role that would better
support staff or students?
On Monday, May 11 staff received an email invitation to share their schedule.
Technical support was offered both via email and over the phone to all staff and
administrators with questions. 3,932 staff across 34 roles in 48 districts were
invited to participate in schedule sharing. 75%, or 2,934 staff shared their
schedules with DMGroup. This response rate was much higher than we have
experienced in other studies, even with the complications caused by COVID 19.
More specifically, in other statewide special education studies, DMGroup
typically received a response rate of about 40% of schedules. With the COVID-19
pandemic, DMGroup anticipated only about 20% response rate; we were
pleasantly surprised at the actual 75 percent response rate. Given the high
response rate, we believe we have a solid understanding of the kinds of activities
special educators engage in over a typical week. Respondents included
representation from all districts in the state.
Below is a summary of the roles that participated in schedule sharing:
• Special Education Teachers (all grades, subjects, and settings)
• Special Education Aides/Paraprofessionals
• Adaptive PE

District Management Group | Helping Schools and Students Thrive | www.dmgroupK12.com
13
• Certified Teacher Tutors
• Case managers
• Educational Diagnostician
• Instructional Coordinator
• Job Coach
• Occupational Therapists & Assistants
• Physical Therapist
• Reading Specialist
• School Counselors
• School Psychologists
• Social Workers
• Speech Pathologists & Assistants
• Transition Coordinators
All practitioner schedules were analyzed to answer questions such as:
● How much time is devoted to supporting students, attending meetings,
doing paperwork, and other tasks?
● What topics are being supported?
● How many students are being supported at a time?
● How much variation or consistency is there between staff with like roles?
● How are students with disabilities served similarly or differently to
students without disabilities?
● How are these questions answered similarly or differently across districts
of varying sizes or characteristics?
Quantitative Data Review:
DMGroup collected and analyzed quantitative data from WDE to further
understand Wyoming special education funding, services, and outcomes. Below

District Management Group | Helping Schools and Students Thrive | www.dmgroupK12.com
14
are some metrics collected from WDE. The full data request to WDE is found in
Appendix E.
● Special education revenues and expenditures, by district and line item
● Special education and general education enrollment, by district, school,
grade, demographic identifier, and disability
● WYTOPP Student achievement data, by district, school, grade,
demographic identifier, and disability
● Disciplinary information, by district, school, grade, demographic
identifier, and disability
● Special education staffing, by position, district, and school
● Average salary and benefits for special education staff, by position and
district
DMGroup also reviewed and analyzed data provided by WDE and available
publicly, through the CRERW reports, special education expenditure report,
state report card, and other reports.
Research, Policy, and Document Review:
DMGroup and their partners collected and reviewed documents, memos,
policies, and research to round out their data collection for this study. This
includes:
● All public guidance and documentation on the use of IDEA, Part B funds to
districts
● All legislative policy on special education funding
● WDE guidelines for special education services and staff to district.
DMGroup also reviewed over 115 research studies on special education services
and best practices, covering the below topics:
● Special education services
● Reading
● Access to general education

District Management Group | Helping Schools and Students Thrive | www.dmgroupK12.com
15
● Interventions
● Teacher quality
● Data and assessment
● Writing
● English language learners
● Social, emotional, and behavioral supports
● The role of paraprofessionals
● Speech and Language Services.
DMGroup puts a strong emphasis on research from:
● What Works Clearinghouse
● National Reading Panel
● John Hattie’s Visible Learning Research
● School districts that have closed the achievement gap.
DMGroup synthesized the research and findings from these document reviews
throughout the teaching and learning, policy, and funding sections of this
report.
District Management Group | Helping Schools and Students Thrive | www.dmgroupK12.com
16
1c. Wyoming Special Education Context & Background
Identification Rates
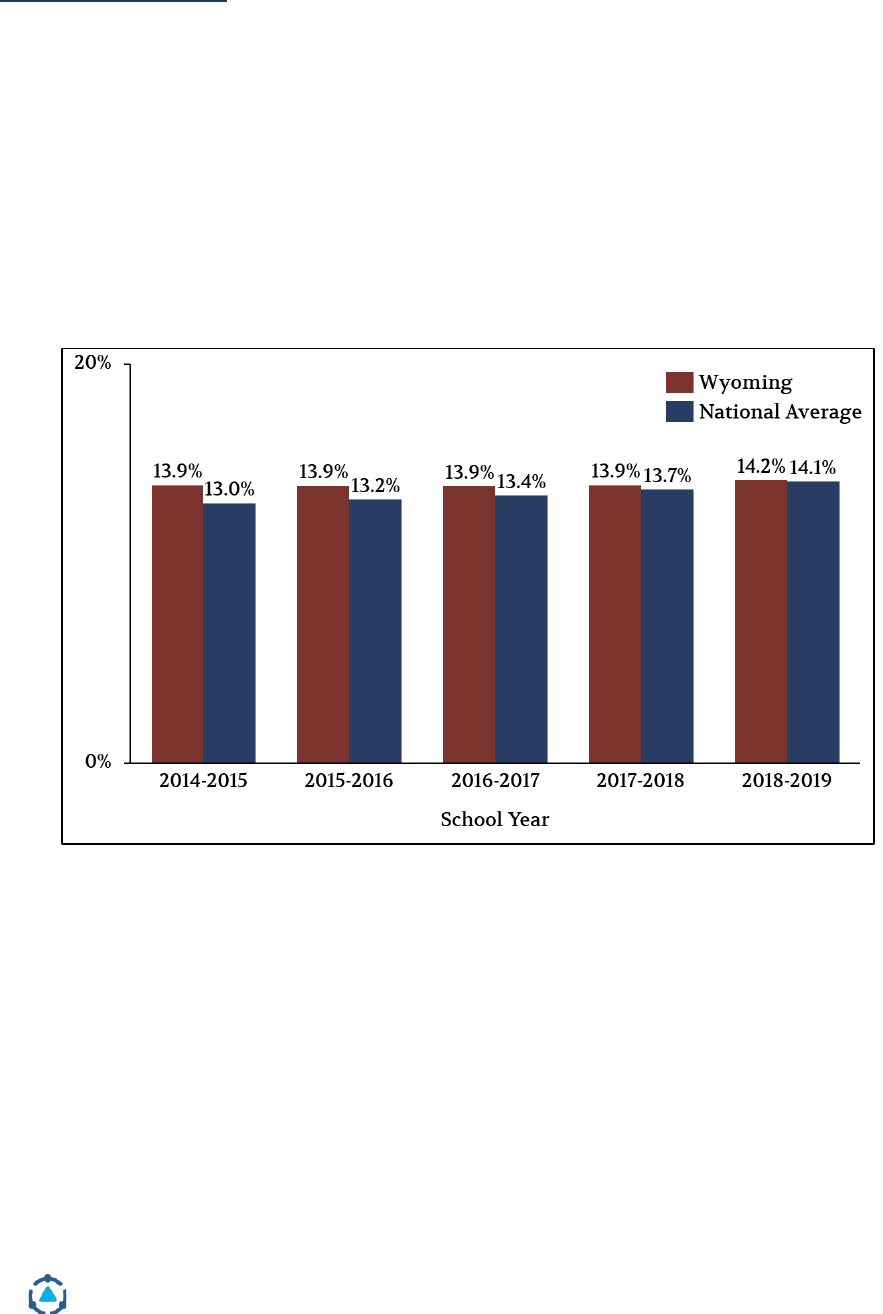
Figure 1 shows that in school year 2018-19, Wyoming school districts identified
14.2% of all students for special education services. This was right in line with the
national identification rate for special education services, which was 14.1% for
that school year. Wyoming’s percent of students with disabilities has stayed
fairly stable for the past five years and has gotten closer to the national average
over time.
Figure 1. Percent of students identified for special education in Wyoming
compared to national average (2014-15 – 2018-19).
Source: WDE enrollment data and the National Center for Education Statistics.
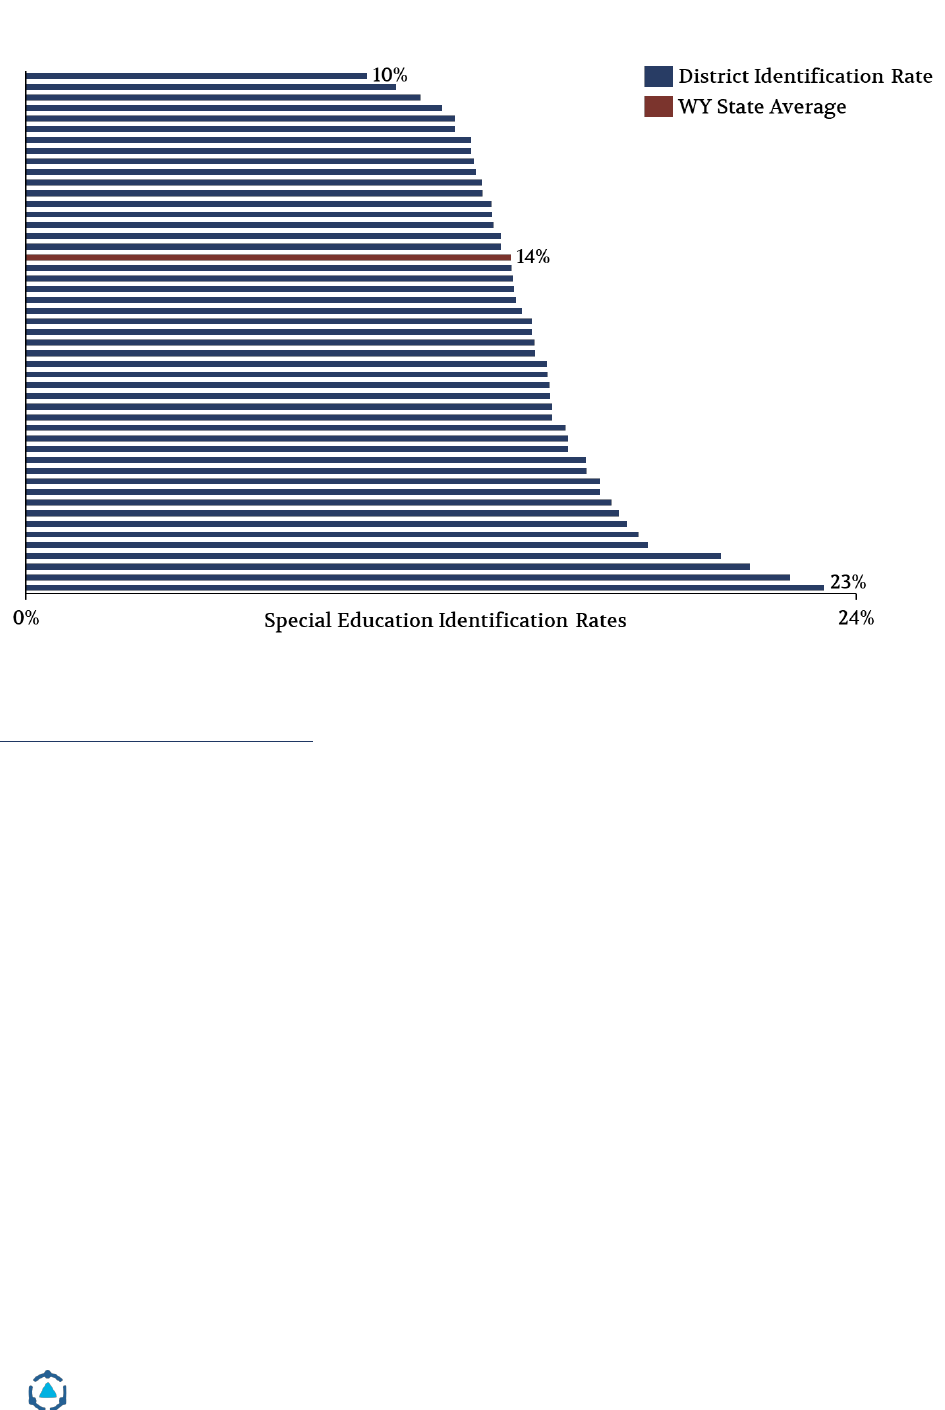
With that said, districts across Wyoming had some variation in their
identification rates. Districts within the state identified between 10% and 23% of
their students with IEPs, as shown by the data in Figure 2.
District Management Group | Helping Schools and Students Thrive | www.dmgroupK12.com
17
Figure 2. School district special education identification rates across Wyoming.
Source: WDE enrollment data.
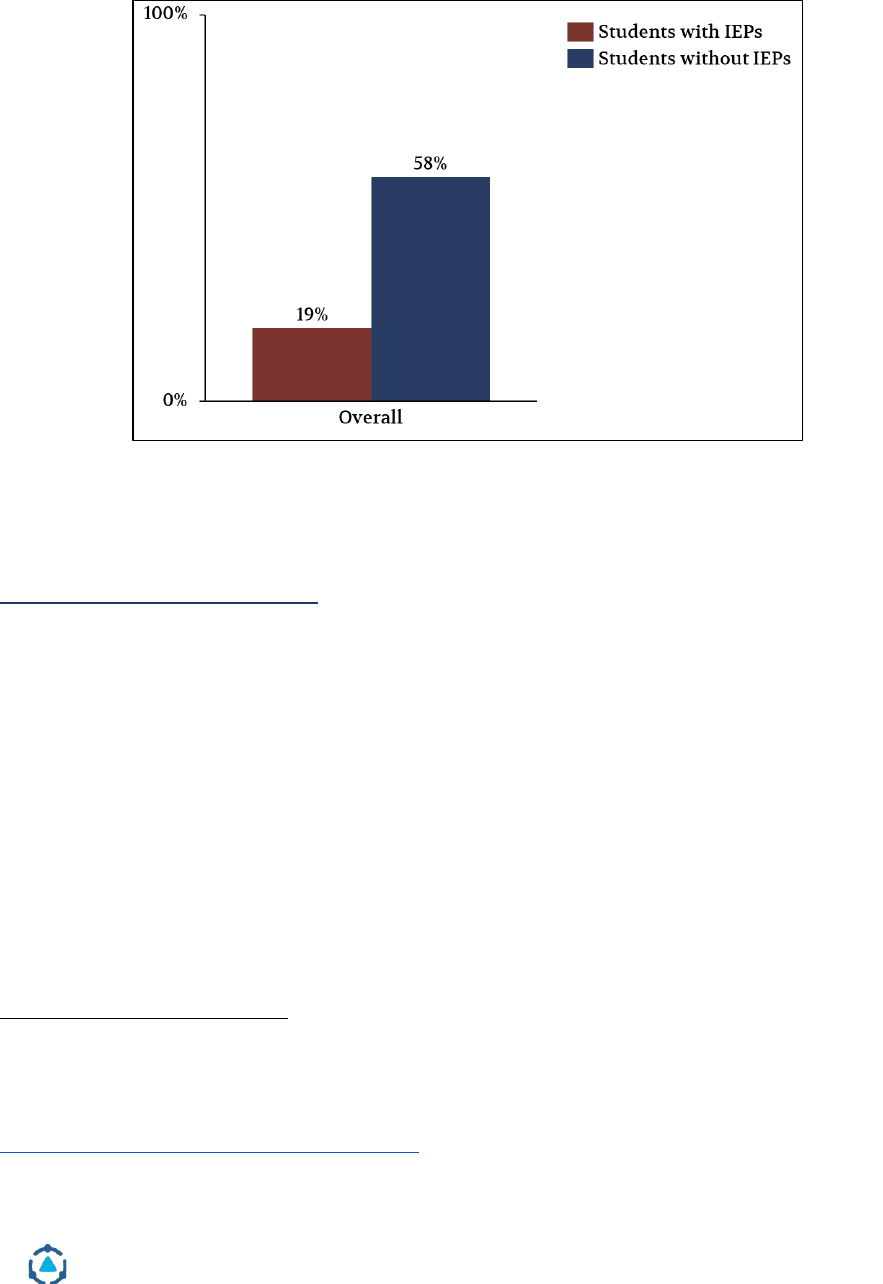
Student Achievement Data
Figure 3 shows that there was a significant achievement gap between students
with IEPs and students without IEPs across Wyoming. The data shows that only
19 percent of students with a disability achieved at or above proficiency on the
WYTOPP test, while 58 percent of students without a disability met this
standard. This gap creates urgency around this study and the need to raise
achievement for students with disabilities across the state.
District Management Group | Helping Schools and Students Thrive | www.dmgroupK12.com
18
Figure 3. Percent of student scoring proficient of advanced on WYTOPP/WYALT
State Assessment for the 2018-19 school year for students with IEPs and students
without IEPs in 3
rd
- 10
th
grades across ELA, Math, and Science.
Source: WDE student achievement data. WYTOPP/WYALT State Assessment proficiency scores in ELA,
Math, and Science were calculated for students with and without IEPs based on the number of students
tested in 2018-2019.
Special Education Spending
Figure 4 shows that on average, Wyoming districts spent about $18,637 per pupil
in additional special education costs in state funded dollars. Districts spend
$20,641 in total special education expenditures, including state funded
expenditures and IDEA, Part B funded expenditures. As outlined in later sections
of this report, this amount is higher than available national benchmarks, both in
absolute dollars spent
1
and in comparison to general education spending.
2
The
overall higher amount may be in part due to specific factors across the state that
lead to higher general education spending, including Wyoming’s rural nature
and higher salaries. Additionally, there are some factors that may exacerbate
special education spending, like the challenge of offering severe needs
programs in small districts or the need to contract out services that may be
1
Kolbe, T., Killeen, K.. Study of Vermont State Funding for Special Education.
2
Kolbe, T. (2019). Funding Special Education: Charting a Path that Confronts Complexity and Crafts
Coherence. Boulder, CO: National Education Policy Center. Retrieved from
http://nepc.colorado.edu/publication/special-ed (page 18).

District Management Group | Helping Schools and Students Thrive | www.dmgroupK12.com
19
provided in district. However, other factors, such as using higher cost service
delivery strategies discussed below, also contribute to this higher spending, the
higher level of spending has not, however been increasing much year over year.
Wyoming’s incremental per pupil special education spending has remained
relatively constant over the past four years.
Figure 4. Wyoming per pupil incremental state funded special education
spending (2015-16 – 2018-19).
Source: WDE Special Education Expenditure Report.
Figure 5 shows that Wyoming’s total state funded special education spending
stayed relatively flat over the past four school years.
Figure 5. Wyoming total state funded special education spending (2015-16 –
2018-19).
Source: WDE Special Education Expenditure Report.

District Management Group | Helping Schools and Students Thrive | www.dmgroupK12.com
20
2. Improving Special Education Teaching & Learning
This section of the report outlines the commendations and opportunities for
consideration across the state of Wyoming related to teaching and learning.
These commendations and opportunities were generated based on the data
DMGroup collected and analyzed, from focus groups, interviews, observations,
schedule sharing, and quantitative data.
2a. Commendations
The state and districts have much to be proud of when it comes to serving
students with disabilities. DMGroup identified 10 areas of strength in how
districts provide services for students, supports for staff, and manage funds.
Services for Students
1. Staff and leaders across Wyoming were passionate, dedicated, and committed to
meeting the needs of all students and providing high-quality services.
Practitioners and leaders in all districts DMGroup spoke with were passionate
and committed to providing what they understand as high-quality services to
students with disabilities. When asked about the strengths of the district,
providing and adapting services to meet each individual student needs was the
most common response. This ranged from decisions about how to respond to a
single student struggling in class all the way up to the structures of programs at
the district level.
In all ten districts DMGroup visited, roles ranging from the superintendent
through paraprofessionals sought to prioritize the needs and best interests of
students in their decision making. One district leader said she was most proud of
their “individualized approach to special education” and the way her team
comes together to decipher the needs of a student and supply the resources they
need to be successful.

District Management Group | Helping Schools and Students Thrive | www.dmgroupK12.com
21
2. Many districts had a robust process for identifying students with disabilities,
through a data-driven Behavior Intervention Team (BIT) or Response to Intervention
(RTI) process.
Most of the districts DMGroup met with used a data-driven approach to identify
students with disabilities, either through a BIT or RTI process. In both of these
models, teachers gathered data on student success in the classroom and went
through a multi-tiered approach of general education interventions and then
gathered additional data before recommending a special education referral. In
one district, a counselor relayed that the process for supporting a student for
whom a concern has been raised includes collaborating with mental health
experts, special educators, general educators, and others to identify student
needs and the implementation of at least two strategies for six week each.
During these trial periods, teachers kept notes on the impact of the intervention.
Only after these interventions have proven unsuccessful was a student
considered for evaluation.
The state's 100% reimbursement model for special education costs could have
presented an incentive to over identify students for special education since
there was no financial impact to the district. However, these data-driven
processes provided an effective process that has eliminated overidentification.
Providing multiple interventions prior to evaluation has increased the
likelihood that students who are recommended for evaluation are struggling
due to a disability rather than varied learning styles. In one district with the BIT
model, staff and administrators noted that a majority of students who entered
the BIT process exited without special education referral, and those who did go
through the evaluation process typically qualified for special education services.
The effectiveness of this approach in preventing overidentification is
underscored by Wyoming’s identification rate of 14.2%, in line with the national
average of 14% (see Figure 1).
3. Schools and districts wrote Individualized Education Program (IEPs) plans and sought to
provide services based on student need rather than available resources.
Special education leaders at WDE noted their emphasis to districts on ensuring
student needs drive service decisions in IEPs. In all ten districts DMGroup spoke
with, this held true. School leaders, teachers, and case managers alike
commented on the quality of Wyoming’s IEP plans, especially compared to those
that come from out-of-state. “Whereas other IEPs are written based on the
available resources and available staff time,” one staff member noted, “IEPs in

District Management Group | Helping Schools and Students Thrive | www.dmgroupK12.com
22
Wyoming are based on student needs.” Districts and schools provided the
services that they believed will best serve students. See the opportunities section
for more on how well services actually align to best practices.
Many districts noted that if a student had a need that would be best served by a
program, service, material or technology that wasn’t readily available in the
district, they would find a way to add the program or acquire the resources as
quickly as possible. For example, one small district had no students with
occupational therapy needs, but when a student was identified as needing these
services, the district contracted with a third party to provide occupational
therapy support.
While districts were often successful in providing services that aligned to
individual student needs, in some cases, especially in smaller districts, they were
constrained by access to specialized resources or special education staff. A
regionalized approach to less common needs may also serve students well and at
a lower cost. See the Opportunity for taking a “regional approach to improving
services” in Opportunity #8.
4. Most districts were committed to providing a wide continuum of services to meet
the needs of all students within their district.
In districts of all sizes, staff members and leaders noted an emphasis on
establishing, refining, and utilizing a continuum of services and multiple
service delivery models. Because staff were committed to aligning student
supports closely to student need, districts provided degrees of support for
students that range from push-in services – where special education teachers
join the general education classroom to support students with disabilities to
access instruction – to self-contained settings where students with more severe
needs are in class with other students with disabilities and the special education
staff is often specialized to support their specific needs. All districts had push-in
services (in larger districts, co-teaching was often used as the push-in model
where a general education and special education co-deliver materials to a class
of special education and general education students), pull-out services (special
education staff remove a student from the general education classroom for a
short period of time to provide specialized instruction or services), resource
classes (portions of the day where students with disabilities with similar needs
are grouped in a class with a special education teacher to work on skills like
math, reading, organization, etc.), and self-contained classes for students with
severe needs. Many larger districts also had multiple self-contained programs,

District Management Group | Helping Schools and Students Thrive | www.dmgroupK12.com
23
including behavioral programs and life skills programs, where students were
grouped by need with specialized curricula, materials, and staff to support their
needs.
Not only were there a wide range of services and settings available, but schools
and staff were also committed to frequently reassessing student needs and
adjusting settings to encourage student skill development. For example, in one
district DMGroup visited, there were a range of services available for students
with emotional needs. Secondary schools had a self-contained emotion
regulation program and a less restrictive setting for students with more
moderate emotional support needs. School leaders shared that students often
moved between these two settings. Additionally, general education teachers
were encouraged and supported to collect behavior data for their students and
collaborate with behavior specialists to meet the emotional needs of students in
a general education setting.
5. There was a statewide focus on serving students in the least restrictive environment
that was embraced by district administrators and staff.
WDE leaders put emphasis and focus on inclusion and have guidelines related to
the least restrictive environment for students with disabilities. The WDE’s Rules,
Chapter 7 states: “To the maximum extent appropriate, children with
disabilities… are educated with children who are nondisabled; and special
classes, separate schooling, or other removal of children with disabilities from
the regular educational environment occurs only if the nature or severity of the
disability is such that education in regular classes with the use of
supplementary aids and services cannot be achieved satisfactorily.”
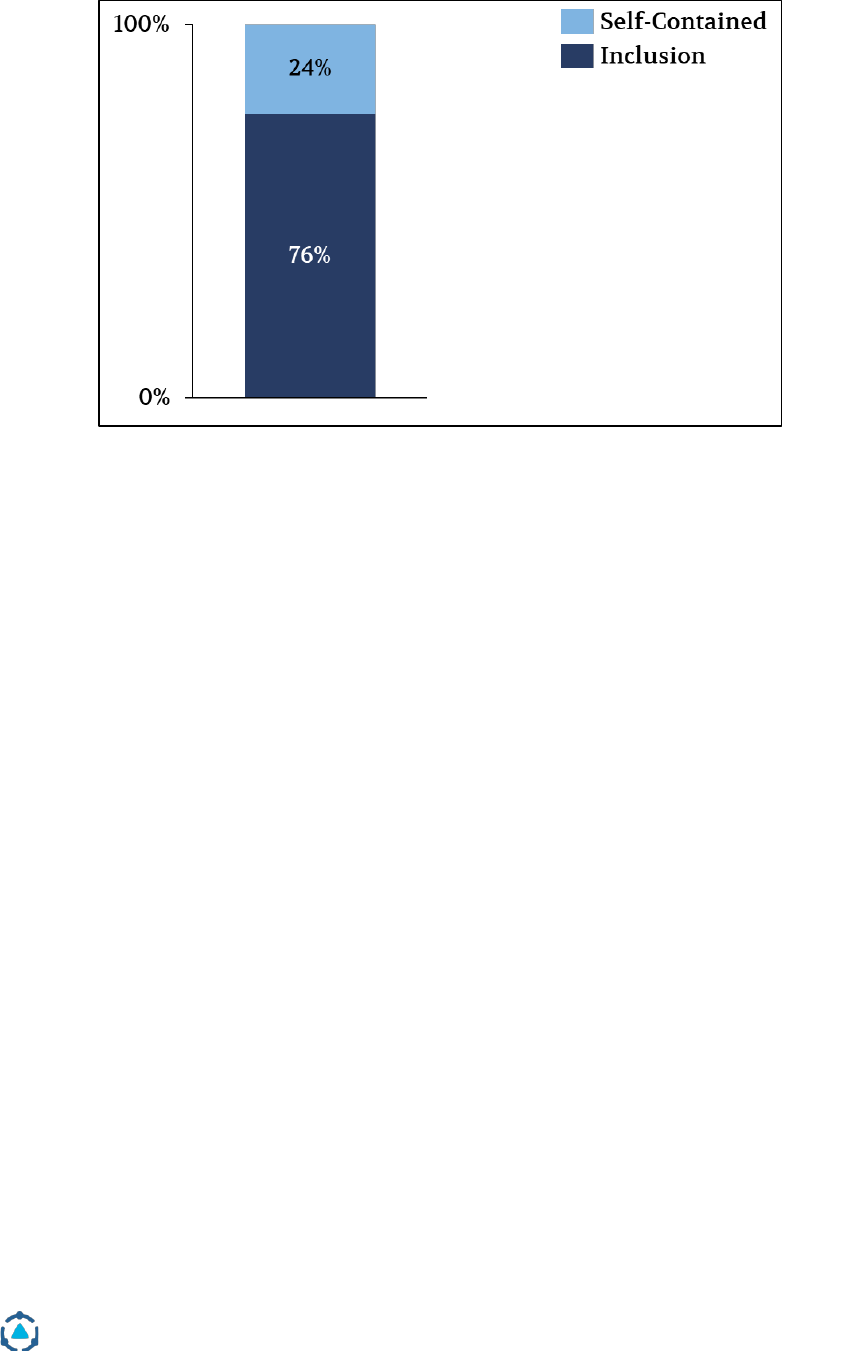
This vision and practice has been applied by leaders in districts and schools, and
by individual practitioners across the state. Illustrated in Figure 6 below, special
education staff across the state reported spending only 24% of their time in a
self-contained classroom whereas they reported spending 76% of their time in
inclusion settings like co-teaching, push in, and pull-out. In focus groups with
special education staff, one noted that they “Push as hard as they can for the
least restrictive environment, so all kids go into the regular education classroom
as much as possible.”
District Management Group | Helping Schools and Students Thrive | www.dmgroupK12.com
24
Figure 6. Percent of special education staff time with students by setting.
Source: Schedule sharing data.
In larger districts in particular, there was a focus on utilizing and improving co-
teaching to serve as many students as possible in general education settings and
to use paraprofessionals to provide academic support to students in a general
education setting when co-teaching is not available. The motivation behind
these strategies was commendable – to serve as many students in the general
education setting. As described in opportunity 3, however, there are alternative
strategies to meet this same goal that have proven to be more effective and more
cost effective at scale.
In almost all of the districts DMGroup visited, students with severe needs in self-
contained settings were included in general education classrooms for at least
part of the day, with support from other staff members. As one staff member
noted, “The goal is to make sure the kids get into the general education
classrooms as much as possible for meaningful learning.”
6. Paraprofessionals were highly motivated, and, in many districts, were used
appropriately to support students with severe needs or to meet health, safety and
behavior management needs. While some aspects of the use of paraprofessionals was
commendable, there is also an opportunity to refine their role to the benefit of
students and the budget. See opportunity 4 for more information.
Paraprofessionals in all ten districts DMGroup met with were passionate and
motivated to support students. In many focus groups, staff members cited

District Management Group | Helping Schools and Students Thrive | www.dmgroupK12.com
25
paraprofessionals going above and beyond to meet student needs and
commented on the value they bring to the classroom. For example, staff shared
that paraprofessionals increased student access to instruction through
proactively learning the academic content, building strong relationships with
students, and getting to know their learning styles. One high school teacher
noted that the paraprofessional in her class is critical for “maintain[ing] the
integrity of the learning environment.”
Because of their contracted workday, paraprofessionals in most districts were
not invited to staff or IEP meetings. However, certified staff across multiple
districts noted that when a paraprofessional worked closely with a student, they
would not hesitate to attend an IEP meeting - without compensation - if asked.
Paraprofessionals themselves noted a desire for more and better training,
including on-the-job training to best support staff and students. One
paraprofessional noted that she invited herself to general education trainings to
continue learning. Certified colleagues noted a similar desire. “Paras are always
looking for more training.”
There is no doubt that many paraprofessionals were eager and energized to
serve and well respected by school and district leaders. In many cases, however,
they were also asked to provide academic support to students. Special education
paraprofessionals statewide spent 63% of their time with students providing
academic support or instruction (see Figure 7); more than two thirds of this time
was spent supporting reading or math. In some districts, especially larger
districts, paraprofessionals took the highest-level group, which enabled content
expert teachers to focus on students who struggled academically. However, in
many other districts, paraprofessionals were asked to provide academic support
to struggling students with mild to moderate disabilities, which is unlikely to
narrow the achievement gap. See Opportunity #4 on “refining the role of
paraprofessionals” for further discussion.

District Management Group | Helping Schools and Students Thrive | www.dmgroupK12.com
26
Figure 7. Percent of time paraprofessionals spend with students by topic.
Source: Schedule sharing data.
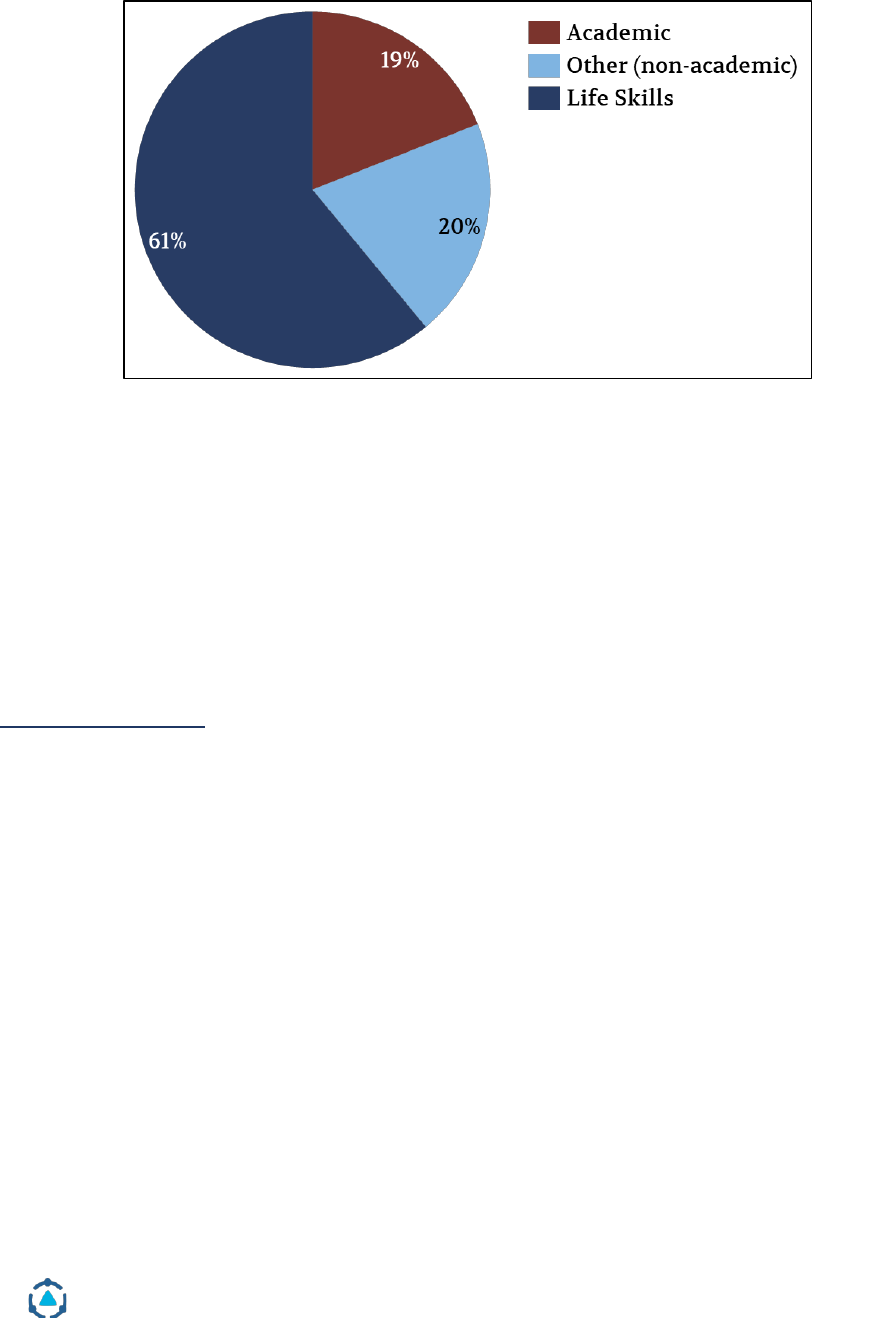
7. Many districts had strong transition services for students with more severe
disabilities aging out of the school district.
Districts across Wyoming had robust systems and programs for transitioning
students with more severe disabilities to alternative settings, including full time
jobs. Transition services include a set of activities that support the student in
moving from high school to post-secondary activities such as higher education,
vocational training, employment, and independent living. By law, transition
services must be included in a student’s IEP after the student turns 16.
Larger districts had life skills programs that teach fundamental living and
working skills to support students throughout their educational career to
prepare them for leaving high school. Some of these districts also had job
coaches and/or transition coordinators devoted to helping students with
disabilities transition out of high school. Statewide, these transition
coordinators and job coaches spent over 60% of their time with students
supporting them on developing life skills, which is very good (see Figure 8).
District Management Group | Helping Schools and Students Thrive | www.dmgroupK12.com
27
Figure 8. Percent of job coach and transition coordinator time with students by
type of support.
Source: Schedule sharing data.
Many districts noted partnerships with community employers to support
students with disabilities in finding employment during and after exiting high
school. One district noted a partnership with the Wyoming Department of
Workforce Services – Vocational Rehabilitation Division where students in the
life skills program worked in the community after lunch and received a
paycheck. In another district, a high school partnered with a local hospital to
provide students internships with the potential of full time, future employment.
Supports for Staff
8. Staff members across districts had extensive opportunities to participate in
professional development opportunities and apply the learning in their classrooms.
Staff in many districts noted that they were provided with ample professional
development opportunities. In one district, for example, case managers and
compliance facilitators attended many external training and professional
development sessions and shared information back with school staff as it
related to their work with students. Moreover, many districts demonstrated
their commitment to new instructional frameworks by providing meaningful
professional learning opportunities. In more than one of the districts DMGroup
visited, staff received trainings on the MTSS guidelines set by the state and
engaged in professional learning communities to develop and standardize a

District Management Group | Helping Schools and Students Thrive | www.dmgroupK12.com
28
school-wide tiered approach to supporting all students in response to the
explicit intent to grow the model at the district level.
Many staff also noted that they were encouraged and supported to pursue
professional learning on their own. For example, in a mid-size district, staff
noted that they were reimbursed in full for professional development they
attended, as long as it aligned with their work and the district’s vision for
supporting students. In another district, staff received partial tuition
reimbursement for enrolling in university programs that led to certification and
credentials in their area of focus.
Furthermore, staff in many districts cited that they were able to apply the
training they received in the classroom, as their administrators provided
resources and time to apply training in real time. Staff shared multiple and
frequent opportunities for collaboration to deepen professional learning
including professional learning communities, weekly staff meetings, and
professional development days. A next step for state and district leaders could
be to review the content of the training staff receive to ensure it is high-quality
and research-based, and to evaluate the impact of those sessions on student
achievement.
9. Special education caseloads – reinforced by the statewide staffing guidelines – were
manageable and may support staff retention.
Practitioners and administrators at the state and local levels noted that district
staffing policies maintain manageable caseloads, particularly compared to other
states. In January of 2019, the WDE released guidelines for special education
staffing, establishing student-to-staff ratio guidance for a variety of special
education positions consistent with historic practice in the state.
Though the guidelines did not lead to a shift in practices in most districts, some
districts around the state updated their staffing procedures and others validated
their staffing approaches with the guidance. The staffing guidelines state that
special education caseloads for a mild to moderate special education teacher
should be between 12 and 15 students. In district interviews and focus groups,
average caseloads frequently fell within this range.
Multiple teachers commented that Wyoming’s strong student support was
notable, in part because of smaller caseloads. The sentiments were echoed by
district administrators, as well. “Our caseloads aren’t at 40 students. That’s part

District Management Group | Helping Schools and Students Thrive | www.dmgroupK12.com
29
of the quality education you receive [in Wyoming],” shared an administrator in
one district. State leaders also noted that smaller caseloads may have increased
special education teacher retention, particularly in hard to staff districts.
While small caseloads were appreciated by staff and administrators alike,
Wyoming had notably lower caseloads than in many other states and districts
around the country that averaged 25 or more students with mild to moderate
disabilities. Wyoming’s caseloads were also typically smaller than the EB
Model’s recommendation of 20 students.
3
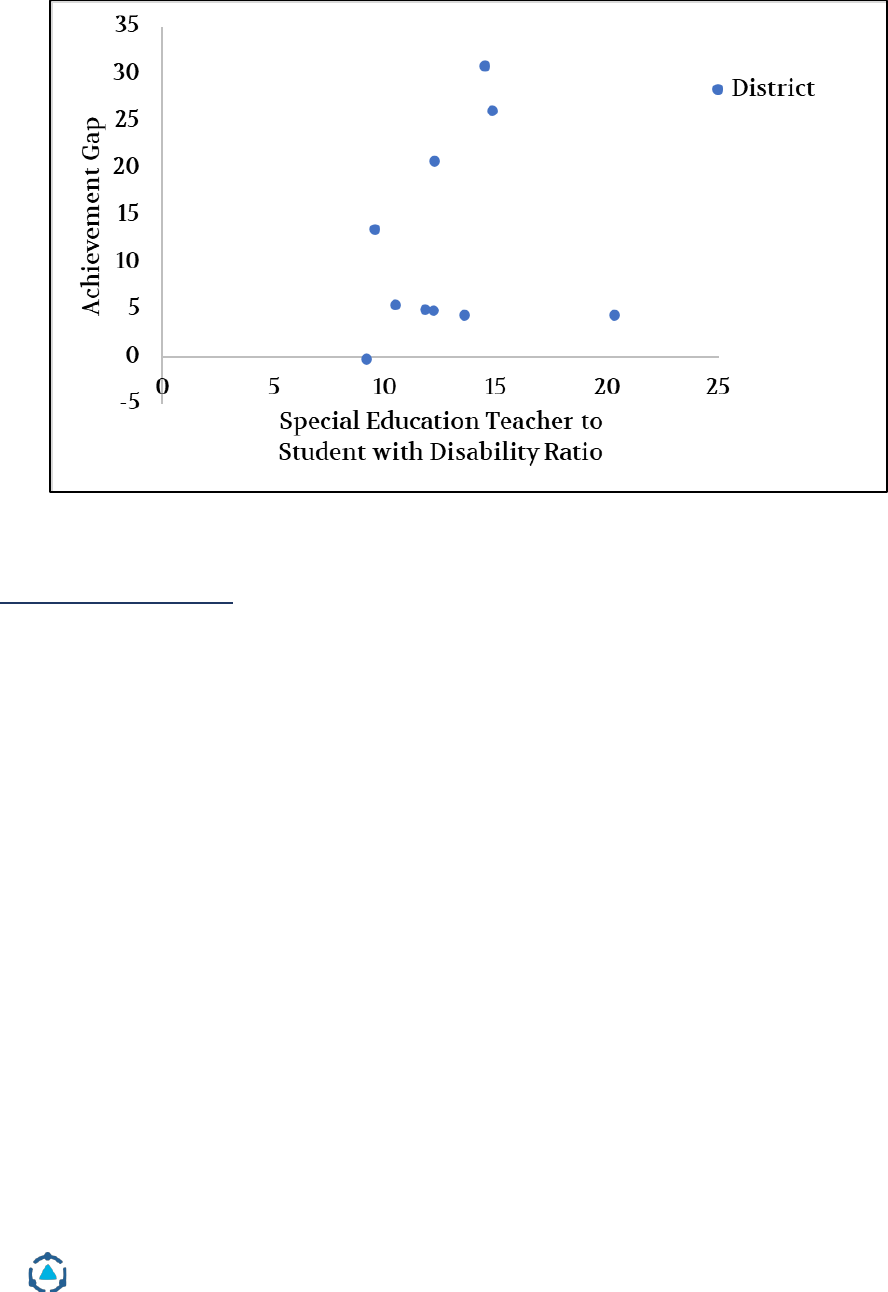
These lower caseloads may have helped with staff retention but have had little
impact on student achievement, and they increased the overall costs of
delivering special education services. A DMGroup analysis of the special
education teacher to student with disability ratio across ten representative
districts in Wyoming showed that there was almost no relationship between
staffing ratios and student achievement (see Figure 9). Districts with lower
staffing ratios did not necessarily have smaller achievement gaps between
general education students and students with disabilities.
This may be because smaller special education caseloads for teachers may have
fueled an overreliance on less skilled paraprofessionals to also support students
with disabilities. Smaller caseloads require more special educators and given the
shortage of special educators in Wyoming; paraprofessionals were often used to
provide the instruction that special educators cannot. The role of
paraprofessionals are discussed further in opportunity 4 and in the special
education funding sections of this report.
3
Allan Odden and Lawrence O. Picus. (2020). School Finance: A Policy Perspective, 6
th
Edition. New York:
McGraw Hill.
District Management Group | Helping Schools and Students Thrive | www.dmgroupK12.com
30
Figure 9. The impact of special education teacher to student with disability
ratio on the achievement gap between students with disabilities and general
education students.
Source: WDE student achievement and enrollment data; WDE Special Education Expenditure Report.
Fiscal Responsibility
10. Districts take seriously being fiscally responsible with their special education
dollars.
District administrators believed they were intentional and restrained in their
year-over-year special education spending based on their understanding of
funding regulations and instructional best practice. One superintendent
described Wyoming school districts as “good stewards of taxpayer dollars,”
indicating that Wyoming school districts believed they were not overspending
special education funds, despite the 100% reimbursement model. In focus
groups and interviews, district administrators noted that they try to be fiscally
minded and do not view the reimbursement model as a “blank check.”
Wyoming’s per pupil special education spending is higher than the national
norm. As shown in Figure 10, in the 2018-19 school year, Wyoming spent $17,412
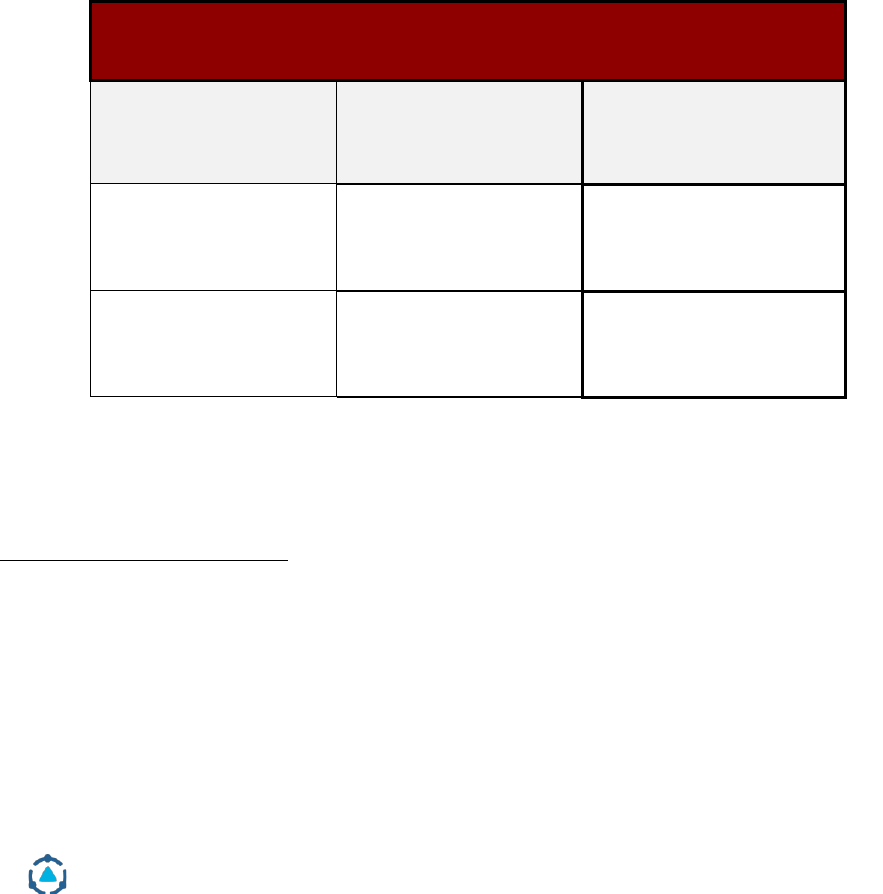
District Management Group | Helping Schools and Students Thrive | www.dmgroupK12.com
31
for each general education student.
4
This figure is from the CRERW report,
which includes general fund, special revenue, and enterprise fund dollars. For
students with disabilities, the state spent an additional $18,637 per student (2018-
2019 fiscal year) in state dollars,
5
and $20,641 in total dollars, including IDEA,
Part B dollars.
6
Thus, the average incremental per pupil special education
spending from state dollars was 1.1 times the general education per pupil
spending, and the total incremental per pupil special education spending was
approximately 1.2 times the general education per pupil spending. This is
roughly 33% higher than the typical average incremental cost of 0.9 times the
general education per pupil spending.
7
Because general education spending was
high statewide, the combined impact on the overall state budget of this
increased spending was not negligible. Further analysis and explanation are
included in the funding section of this report.
Figure 10. Wyoming per pupil spending on general and special education.
FY 2018-2019 Wyoming Per Pupil Spending
(General and Special Education)
General Education
Per Pupil Spending
Additional Special
Education
Per Pupil Spending
Incremental Spending
Multiplier
$17,412
$18,637
(state dollars only)
1.1x
$17,412
$20,641
(state and estimated
federal dollars)
1.2x
Source: WDE CRERW Report and WDE Special Education Expenditure Report.
However, districts have not increased spending dramatically year-over-year.
Some district leaders also noted that the rural nature of the state may cause the
same services to cost more in Wyoming. For example, rural districts found it
4
Wyoming CRERW Report
5
Wyoming Special Education Expenditure Report
6
Wyoming Federal 6B Expenditures – FY19
7
Kolbe, T. (2019). Funding Special Education: Charting a Path that Confronts Complexity and Crafts
Coherence. Boulder, CO: National Education Policy Center. Retrieved from
http://nepc.colorado.edu/publication/special-ed (page 18).

District Management Group | Helping Schools and Students Thrive | www.dmgroupK12.com
32
hard to staff related service positions like speech and language pathologists,
occupational therapists, and physical therapists. Additionally, these districts
typically required less than a full-time employee to meet student needs.
Therefore, many rural districts contracted out related service staff, which is
more expensive. School leaders also noted that recruiting and retaining quality
special education staff is much more challenging in a rural setting. Finally, rural
districts tend to have higher costs because special education staff often support
fewer students, which increases the per pupil special education costs for the
school.
District Management Group | Helping Schools and Students Thrive | www.dmgroupK12.com
33
2b. Best Practices Framework
DMGroup compared current practices against a framework of best practices to
raise achievement for students with disabilities and students who struggle
without a disability.
Best Practices
The framework comes from experience partnering with more than 200 districts
around the country with best practice research, with an emphasis on research
from the What Works Clearinghouse, the National Reading Panel, and John
Hattie’s Visible Learning Research. While many of these best practices are
widely accepted among educators and are seen as ‘common sense,’ faithful and
effective implementation of these best practices is hard and requires a
measured, coordinated systems thinking approach. This framework is also
reflective of the school improvement approach embedded in the EB Funding
Model.
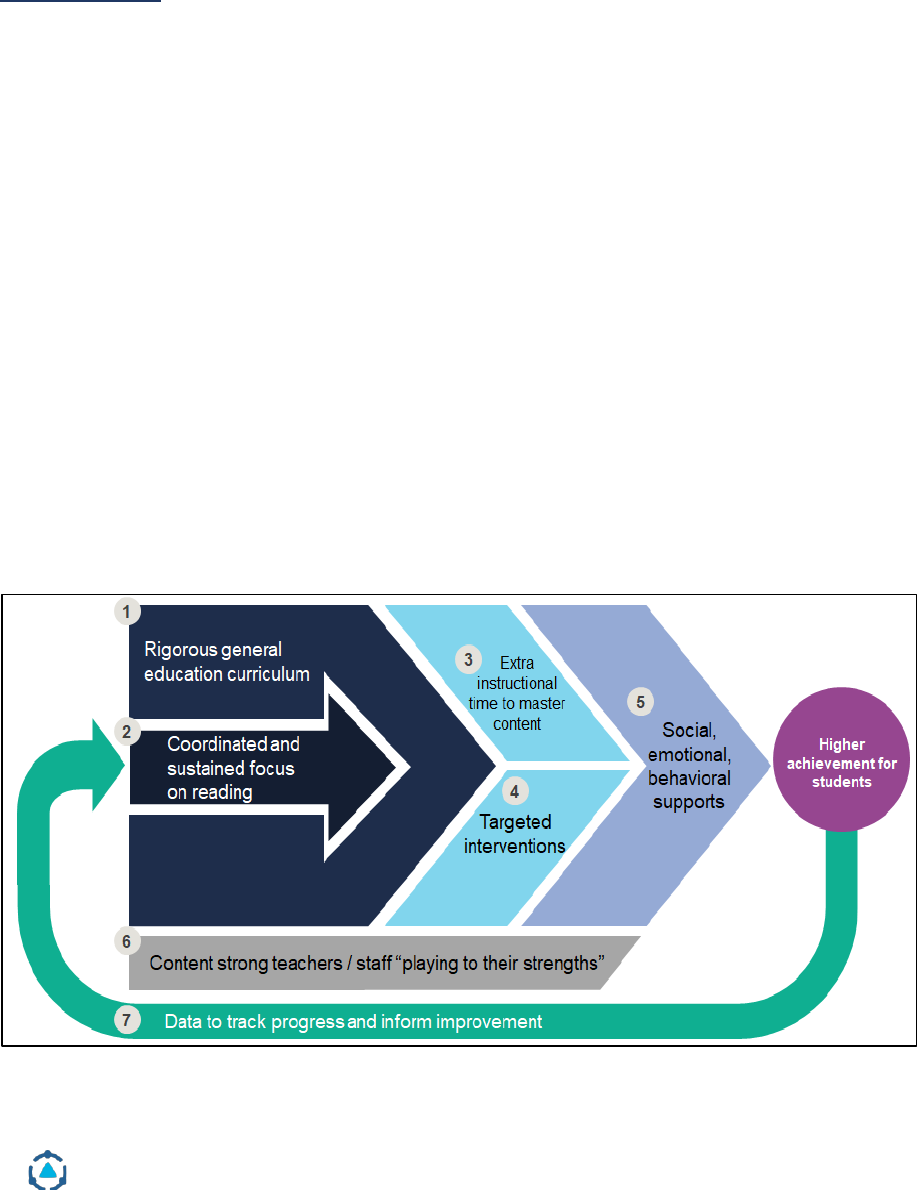
There are seven interconnected best practices that can help students requiring
additional support achieve high levels of success in a cost-effective manner. This
is true both for students with mild to moderate disabilities and students without
disabilities. These students are often served best using the same strategies
outlined in the below framework. Approximately 85% of students with
disabilities have mild to moderate disabilities.

District Management Group | Helping Schools and Students Thrive | www.dmgroupK12.com
34
1. Rigorous general education curriculum
• General education impacts all students; there is a high correlation
between successful general education outcomes and successful
special education outcomes.
• High expectations matter.
• Coaching provided by Instructional Facilitators is a highly effective
professional development tool for improving general education
instruction.
2. Coordinated and sustained focus on reading
• Reading is the gateway to all other learning.
• Students should receive at least 90 minutes a day of literacy
instruction at the elementary level.
• A science-based approach to literacy should include the explicit
teaching of phonemic awareness and phonics as well
comprehension at the elementary level; explicit instruction in
reading at the secondary level should be provided when needed by
struggling students.
• Identifying struggling readers should begin in Kindergarten and
continue at each grade level.
• One person should be in charge of reading at the district level.
3. Extra time to learn
• Struggling students should receive additional time to learn daily.
• Students should receive at least 30 min / day additional time for all
struggling readers at the elementary level, and at least 60 minutes /
day or one additional period of math, ELA, or reading at the
secondary level.
• Staff for this extra time is amply provided by the EB funding Model.
4. Targeted interventions

District Management Group | Helping Schools and Students Thrive | www.dmgroupK12.com
35
• Struggling students should receive interventions that target
specific skill gaps.
• Intervention should be tightly connected to core curriculum and
instruction.
• Students should be dynamically grouped based on skill gaps.
• Training and background of the instructor, the length of
intervention time provided, and the type of instruction presented
during intervention are more significant factors for increasing
student achievement than intervention group size.
5. Content strong teachers
• Nothing matters more than the effectiveness of the teacher.
• Students who struggle should receive targeted support from staff
highly skilled in the content area they support that have a proven
track record of success. Put differently, students struggling in math
should be provided extra help by a math teacher; students
struggling in science should be provided extra help by a teacher
trained in science, etc.
6. Social-emotional and behavioral supports
• Meeting the social, emotional needs of students is a prerequisite to
meeting their academic needs.
• Training and supports should be provided to strengthen the
capacity of the general education teacher to proactively manage
student behaviors.
• Behavior-related data should be collected through frequent student
observations to identify and refine supports needed and monitor
progress.
• Schools should utilize a common language and coordinated,
scaffolded approach to social, emotional, and behavioral supports.
• Schools should identify a model for supporting students with
moderate or severe behavior-related needs that relies on specialized
expertise.

District Management Group | Helping Schools and Students Thrive | www.dmgroupK12.com
36
• Engaging families is important to effectively support the whole
student.
• It is important to clarify roles and responsibilities for staff and how
they are incorporated into the district’s overall approach to
supporting students.
• Guidelines should be established to specify the amount of time staff
will dedicate to their primary focus and other responsibilities.
7. Data to track progress and inform improvement
• Performance data from short cycle assessments should be
frequently used as a way to inform instruction and progress
monitor students.
• Common benchmarks within and across schools should be
established to have a consistent approach to identifying the needs
of students.
DMGroup compared services across Wyoming against these best practices and
found some areas of strength and some opportunities to better implement these
best practices. This framework should guide districts and the state in
considering how they want to improve services for students.
The following section of the report outlines DMGroup’s findings about how
students with disabilities are served, both in relation to special education and
general education, as outlined in the above framework. Throughout the
document, many opportunities apply to students with mild to moderate
disabilities while others apply to students with severe disabilities. This will be
noted throughout the report.
Throughout this section of the report, some opportunities are unique to districts
of specific size, as the challenges, needs, and solutions in small and rural
districts are often different from those in larger districts. For the purposes of
this report, small districts are defined as having fewer than 800 students
enrolled. Medium districts have between 801 and 5,000 students enrolled. Large
districts have more than 5,001 students enrolled.

District Management Group | Helping Schools and Students Thrive | www.dmgroupK12.com
37
2c. Opportunities
Opportunity #1: Strengthen Tier 1 classroom instruction by increasing the
capacity of general education teachers to support all learners through a
combination of a redesigned approach to high-quality instructional coaching
(instructional facilitators), master teachers and model classrooms.
Strong Tier 1 instruction is critical for student success. If core instruction is
strong, all students benefit, especially students with disabilities who spend most
of their day with a general education teacher. Within Tier 1 instruction a hyper
focus on literacy will serve students with disabilities well. However, staff and
district leaders in Wyoming expressed a need to strengthen Tier 1 instruction
and the support for general education teacher. Without strong Tier 1 instruction,
student success relies too much on out-of-classroom supports, for which there
can never be enough time, staff capacity, or resources.
Why is Tier 1 Instruction So Important?
Tier 1 refers to the instruction that is provided to all students in the general
education classroom. Research suggests that 80-85% of students can effectively
learn grade level material through high-quality Tier 1 instructional strategies.
For the remaining 15-20%, Tier 2 and 3 interventions are required to increase
student success.
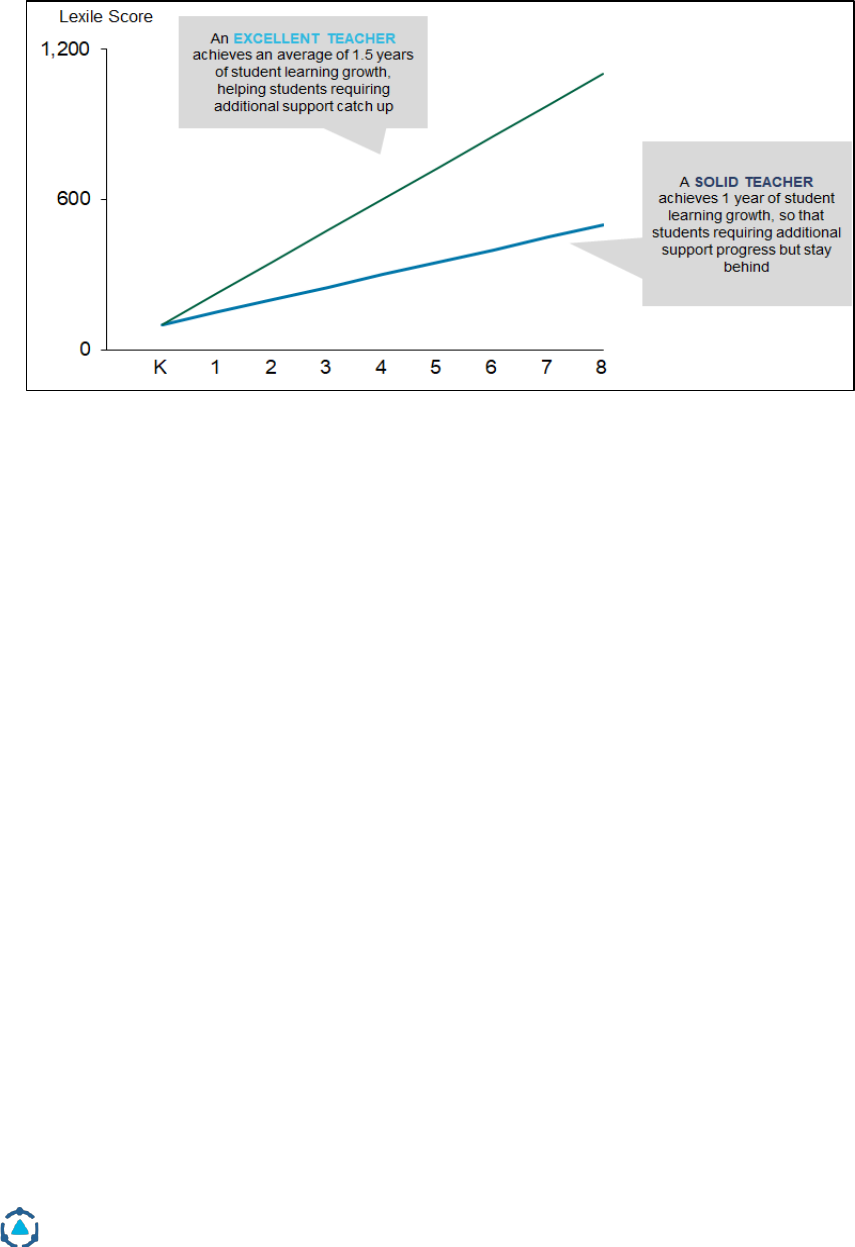
Strong Tier 1 instruction is dependent on teacher skill and training. Figure 11
demonstrates that, on average, a solid teacher can support students in gaining a
year of growth each academic year while an excellent teacher can help students
achieve a year and a half of growth per academic year. In the districts that
DMGroup visited, staff and district leaders noted the need to strengthen and
improve Tier 1 instruction in Wyoming. Many noted that there was a strong
focus on Tier 1 instruction and an acknowledgement of its importance, but that
there was a lack of consistent resources and supports to build teacher skill,
particularly around meeting the needs of struggling learners, including
students with mild to moderate disabilities.
Central to increasing classroom teacher capacity is the need to ensure all
classroom teachers are well trained and highly skilled in science based reading
practices. The majority of students who have mild to moderate disabilities and
the overwhelming majority of other struggling students have challenges to read
and comprehend well. Unfortunately, many classroom teachers are not taught
District Management Group | Helping Schools and Students Thrive | www.dmgroupK12.com
38
the fundamentals of science based reading in their college programs.
Strengthening these skills can be life altering for students and greatly reduce
the need for special education and other interventions in future years.
Figure 11. Impact of teacher quality on student Lexile scores
Source: National Council on Teacher Quality: Expanding the Teacher Quality Discussion; Public
Impact’s OpportunityCulture.org.
To ensure that all students, including those with disabilities, have access to the
same core content, it is critical that students with mild to moderate disabilities
are included in the general education classroom for 100% of core instruction
time for at least math, ELA and reading. This core instructional time is critical to
mastering grade level material and should not be lost to provide special services
to students. In many districts across the U.S., students with mild to moderate
disabilities are pulled from the general education classroom during ELA and/or
math lessons to receive special education or related services, often to meet the
scheduling needs of the special educator or related service provider. This
disadvantages students with mild to moderate disabilities who typically
struggle with core content but, with this practice, are getting get less instruction
in core content than their non-struggling peers.
In Wyoming, strong inclusion practices provide students with mild to moderate
disabilities with access to general education staff and administrators work hard
to prioritize keeping students with mild to moderate disabilities in the general
education classroom during core instruction by scheduling special education
and related services during other parts of the day, where possible. In focus
groups, related service providers in more than one district commented on this
District Management Group | Helping Schools and Students Thrive | www.dmgroupK12.com
39
commitment to protect core learning time for students sharing that one of the
greatest challenges they experience is developing schedules that meet the
service needs of the students but do not conflict with core instruction time.
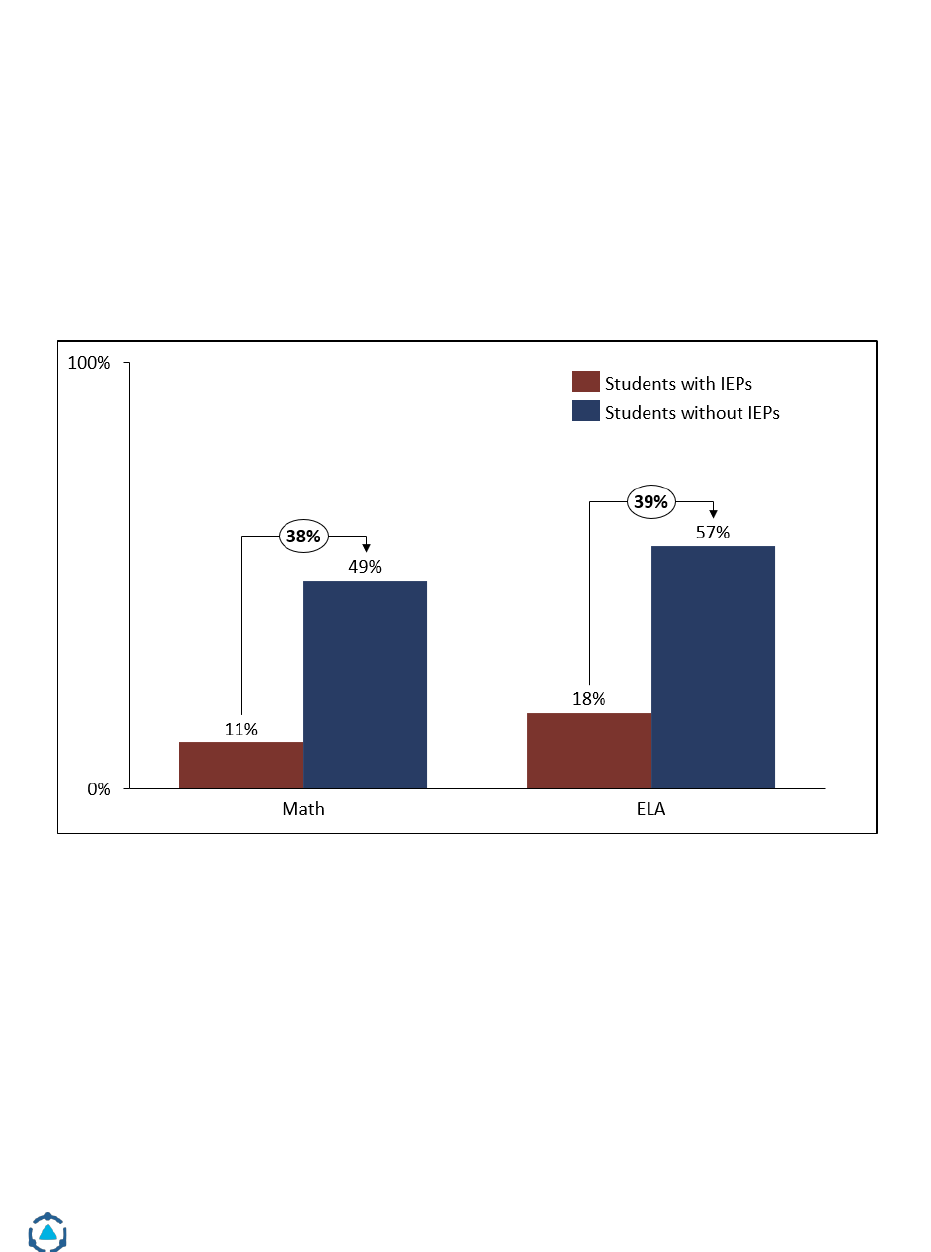
All students in Wyoming would benefit from improved Tier 1 instruction. Based
on 2018-2019 WYTOPP State Assessment scores, fewer than 50% of 10
th
grade
students were scoring proficient or advanced in math and only 57% were scoring
proficient or advanced in ELA (see Figure 12). However, effective Tier 1
instruction is even more critical for students with disabilities in Wyoming, as
they consistently underperform compared to their general education peers and
therefore require consistent, strong Tier 1 instruction to close that gap.
Figure 12. WYTOPP State Assessment scores for the 2018-19 school year for
students with IEPs and students without IEPs in 10
th
grade.
Source: WDE student achievement data.
Lastly, strong Tier 1 instruction reduces the number of students who need out of
classroom supports, thereby reducing the need for interventionists and special
education teachers. Several special education staff interviewed by DMGroup
added that ineffective Tier 1 instruction often leads to an increase in special
education referrals and services. As one special education facilitator noted,
“Special education has not been part of Tier 1 conversations, but that’s really
where the challenge exists.”
District Management Group | Helping Schools and Students Thrive | www.dmgroupK12.com
40
Three ways to improve Tier 1 instruction.
Improving Tier 1 instruction is best done through a combination of means
including:
• High quality instructional facilitators
• The use of master teachers
• The identification of model classrooms
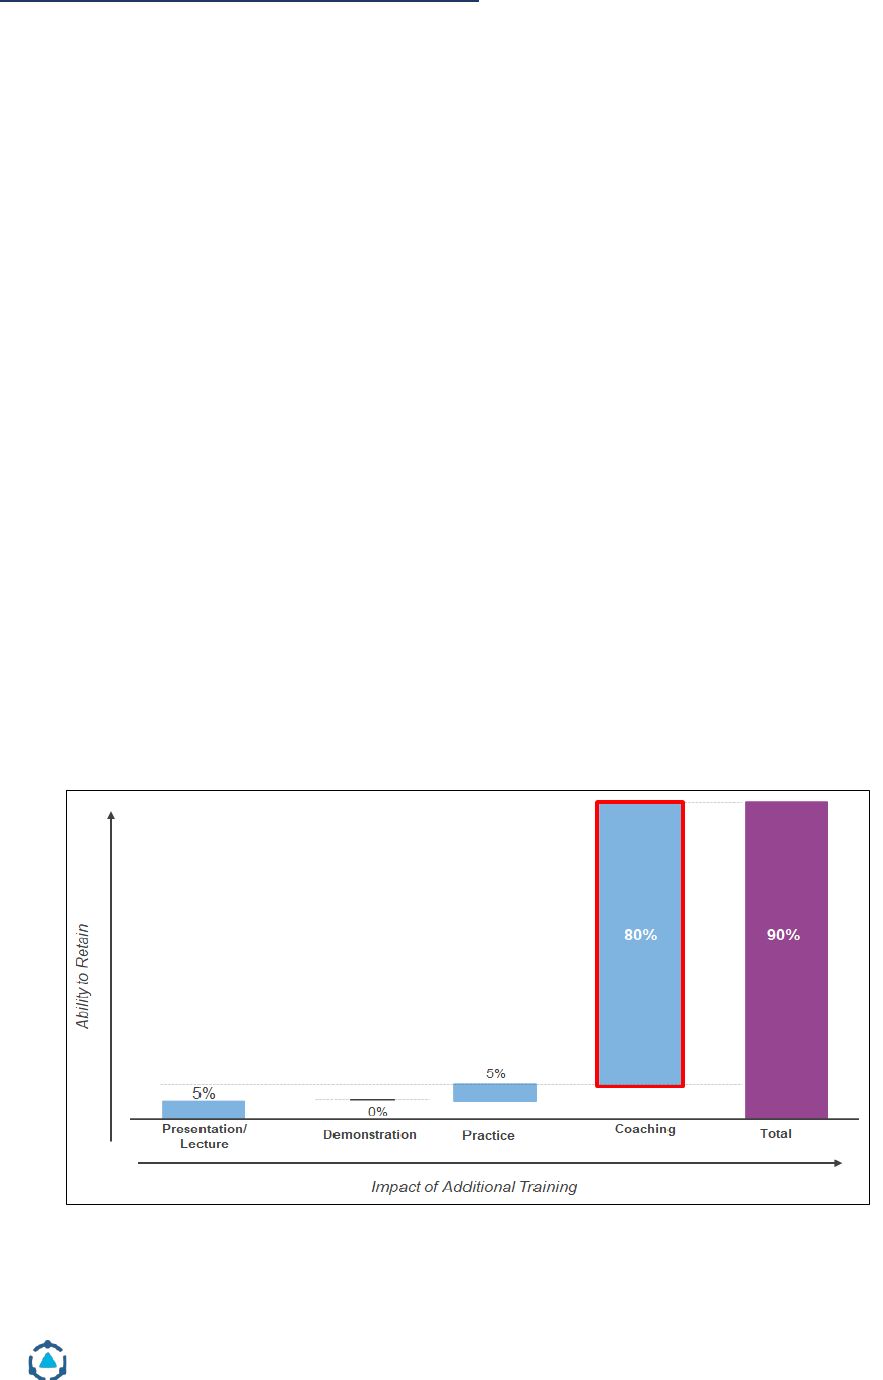
Traditional professional development on its own has not been shown to be
effective in most cases.
The most effective means of improving Tier 1 instruction is through
professional development coupled with strong instructional coaching. Teachers
often retain only a small amount of sit-and-get style professional development
but coupling trainings with instructional coaching has shown to increase the
retention of new information significantly by allowing teachers to practice and
iterate on new skills alongside reflection and feedback (see Figure 13 below).
Effective instructional coaching typically follows a cycle illustrated in Figure 14
of identification, planning, practice, and reflection that helps to fully embed
new pedagogical learnings into teachers’ daily instructional practices and builds
strong habits for continuous improvement.
Figure 13. The impact of additional training practices on teacher knowledge
retention.
Source: Joyce & Showers, 2002.
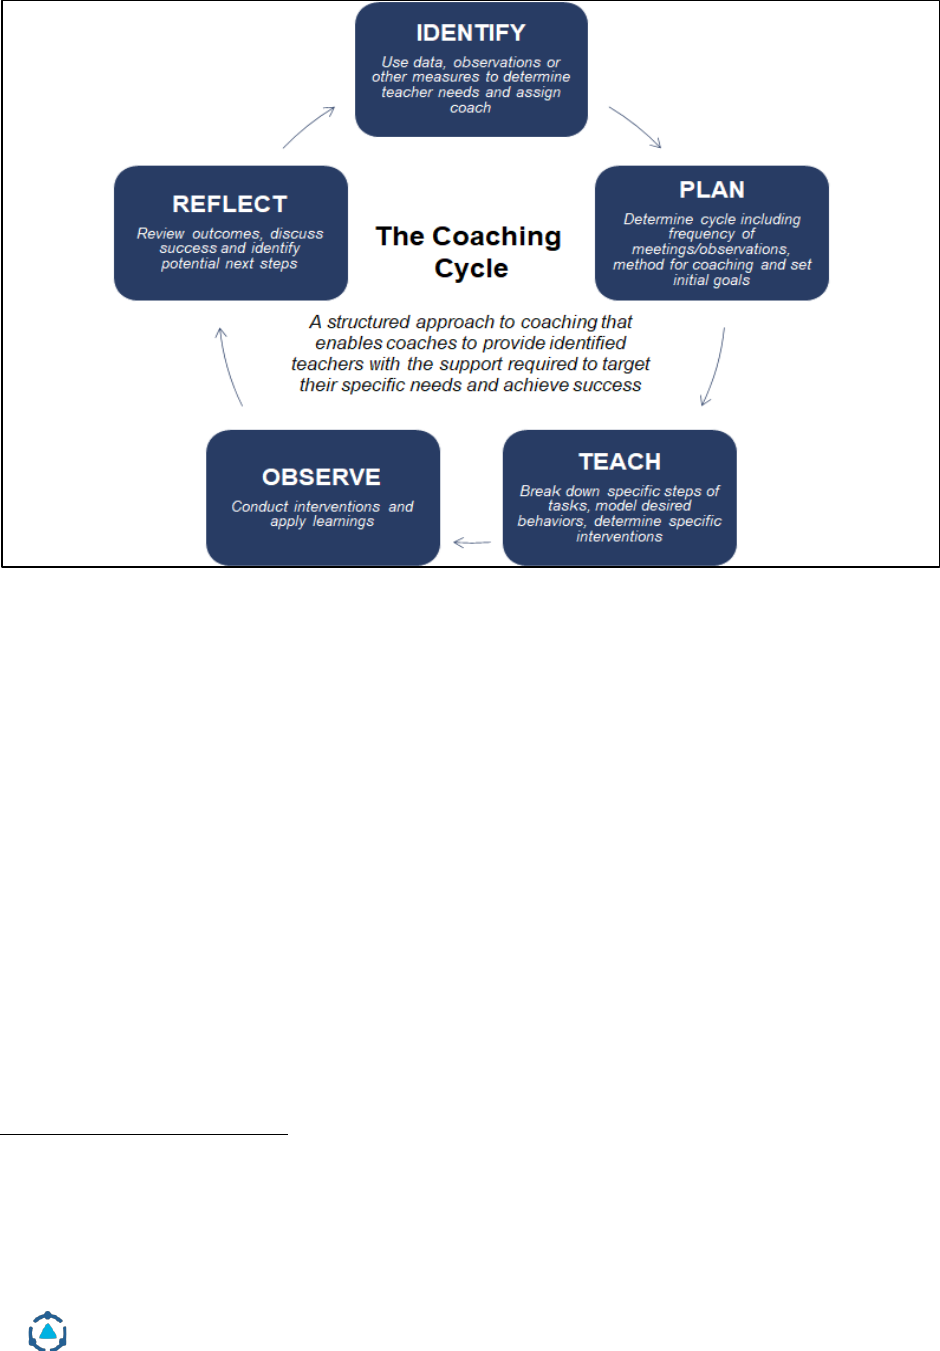
District Management Group | Helping Schools and Students Thrive | www.dmgroupK12.com
41
Figure 14. The coaching cycle.
Source: DMGroup.
Coaching can help teachers to engage students in higher order thinking, to teach
reading using a science based approach, use real-time short cycle/formative
assessments to check understanding, analyze student data to inform instruction,
maintain grade level expectations for all students, and progress monitor results.
These skills build the capacity of teachers to meet the wide range of learning
needs in their classroom, including those of students with disabilities.
Instructional coaching has the added benefit of reducing staff turnover.
Targeted support increases staff effectiveness leading to greater job
satisfaction.
8
Moreover, the coaching model reinforces the culture of
collaboration within a school thereby strengthening teacher relationships and
feeling of support in their role.
9
8
Frazier, Rebecca, 2018
9
Annenberg Institute for School Reform, 2004

District Management Group | Helping Schools and Students Thrive | www.dmgroupK12.com
42
Challenges with instructional facilitators in Wyoming
While instructional coaching has been proven to be highly impactful when done
well, not all districts in the state have confidence that it can be done well at scale.
Some districts and many of the best practice schools in the state have had
excellent outcomes in part due to effective use of instructional facilitators.
Others have had a different experience and have reduced their use over time.
There can be a number of reasons for this lack of enthusiasm for expanding or
even continuing the use if IFs. A shortage of sufficient highly skilled teachers, a
reluctance to pull highly skilled teachers from the classroom, or IFs being pulled
into lower impact work are all likely contributors.
Given the current experience , both very positive and not, it would be wise to
review and revise the approach to instructional coaching before expanding it. It
would also be wise to augment instructional coaching with master teachers and
model classrooms.
Why Doesn’t the Current Allocation of Instructional Facilitators (IFs) Meet the
Need in Wyoming?
Though some Wyoming districts have invested in instructional facilitators or
coaches, these staff members spent only a small portion of their time on actually
coaching teachers. Staff from the districts DMGroup visited shared that the
instructional facilitators did not have much time to spend with teachers, and
also that many teachers did not have adequate access to IF support.
Instructional facilitators themselves noted that they were often pulled in many
different directions and did not get to devote as much time to coaching teachers
as they want.
Based on the schedules shared by staff in Figure 15 below, facilitators spent only
33% of their time supporting staff through professional development and
collaboration. Facilitators spent an additional 20% of their time on instruction
and support for students and 30% of their time on administrative
responsibilities like paperwork and meetings.
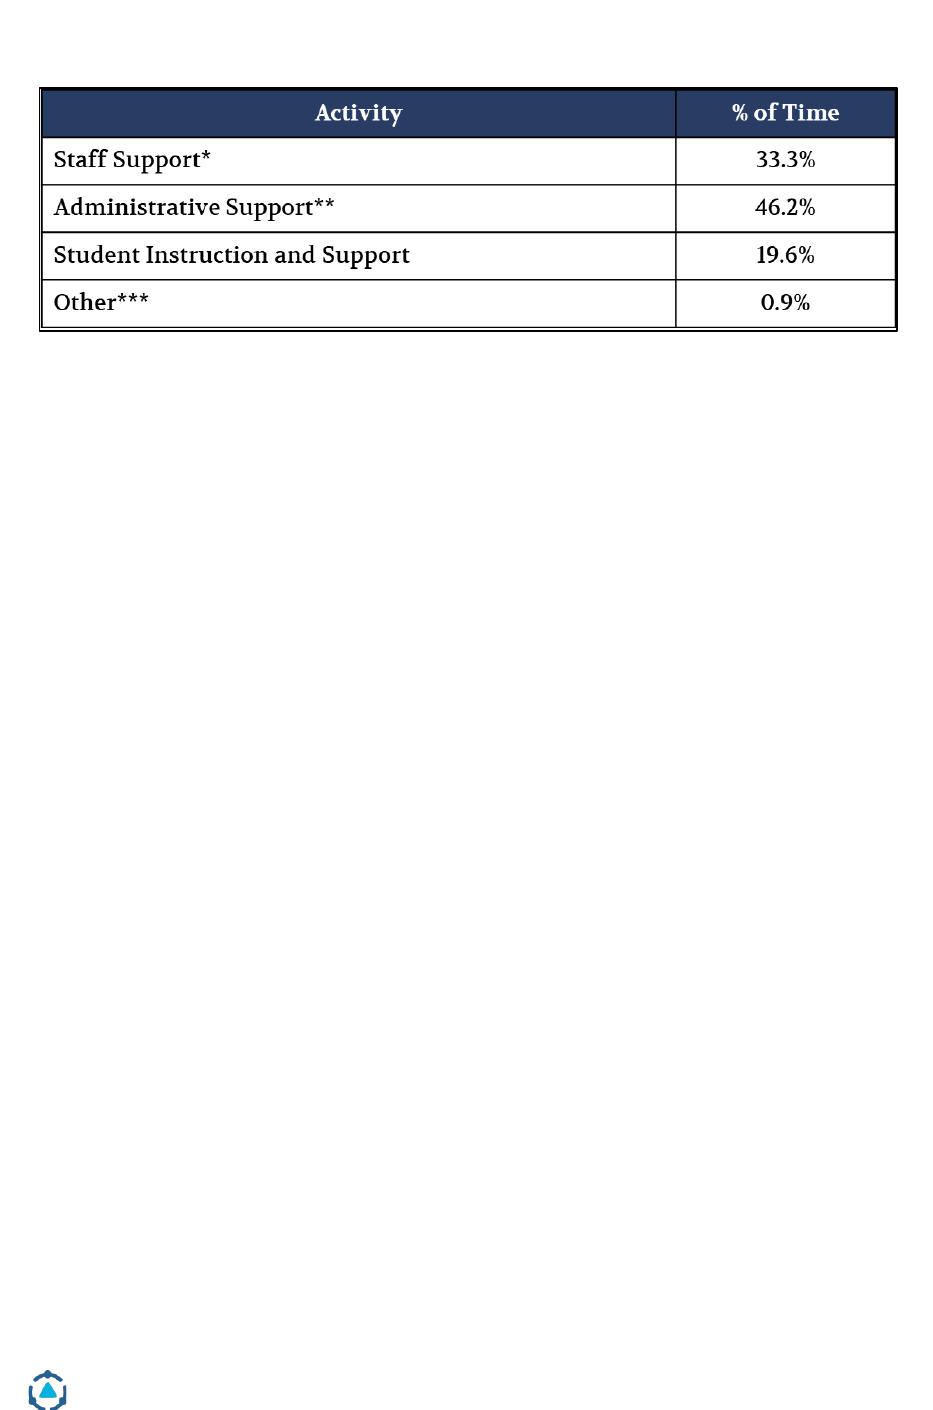
District Management Group | Helping Schools and Students Thrive | www.dmgroupK12.com
43
Figure 15. Breakdown of time during a typical week for instructional
facilitators in Wyoming.
Source: Schedule sharing data. *Staff Support includes: Professional development (giving),
collaboration with colleagues and paraprofessional management. **Administrative Support includes:
Attending meetings, planning/materials preparation, attending IEP meetings, IEP responsibilities, and
paperwork. ***Other includes: Personal lunch, travel between schools/transition time, assigned school
duties, and over/under reported time.
State and district investments in instructional facilitators has been decreasing
over the last seven years in Wyoming due to the reduction in targeted state
funding for facilitator positions and moving the funding for those positions
from a categorical to block grant model. Even before this shift in funding
models, Wyoming districts were hiring fewer instructional coaches than were
allocated by the legislative model. The decline in funding and its move away
from a categorical funding model, however, further undermined the importance
of coaching for effective Tier 1 instruction and reduced the motivation for
districts to allocate funds towards instructional facilitators. As a result, the
number of facilitators employed by districts between the school years 2013-2014
to 2017-2018 decreased by more than one third.
Picus and Odden explain in their report (illustrated in Figure 16 below) the
impact of the shift in funding models on the number of instructional facilitators
across the state.
“In 2013-14 the Legislative Model allocated a total of 266.5 instructional coach
positions to Wyoming school districts. The districts employed 242.1
instructional coaches or 24.4 fewer than allocated. In 2014-15 the Legislative
Model allocated a total of 270.2 instructional and districts hired 249.7
individuals, 20.6 fewer than the model allocated. Funding for instructional
coaches (IFs) began to drop when the IF positions were rolled into the Block
Grant. As a result, in 2017-18 the Model provided for 247.2 IFs but districts
hired only 154.3, and for the 2018-19 school year the Model reduced the number

District Management Group | Helping Schools and Students Thrive | www.dmgroupK12.com
44
of IFs resourced to 135.4 with districts hiring 142.9.
10
If the state considers IFs a
key ingredient for school improvement, it would be wise to put the funds back
into a categorical program and fully fund the program identified in the EB
Model.”
Figure 16. Instructional facilitator allocation in legislative model versus actual
FTE hired by Wyoming districts.
Instructional Facilitators (IF) Allocations vs Actual FTE
School Year
Legislative Model
allocated IF positions
Number of IF positions
hired by Wyoming
districts
Difference
2013-2014
266.5 FTE
242.1 FTE
24.4 FTE
2014-2015
270.2 FTE
249.7 FTE
20.6 FTE
2017-2018
247.2 FTE
154.3 FTE
92.9 FTE
2018-2019
135.4 FTE
142.9 FTE
-7.5 FTE
Source: Picus and Odden (2020).
What Could the State Do to Further Support Teachers in Meeting the Needs of
All Students?
The state could double down on their investment in coaching by fully funding
the instructional facilitators outlined in the EB model. School districts and the
state could also consider developing guidelines for instructional coaches and
removing additional duties from these staff members’ plates to increase the
time they can spend supporting skill development in teaching staff.
In conjunction with this the state should review in detail why IFs have been
more successful in some districts than others. It is likely that a re-imagined
approach to IFs might include greater use of part time retired teachers to fill the
role, more carefully selection criteria and even the use of remote coaching.
Before the pandemic made Zoom a staple of K-12 a number of districts have had
good results with coaches who spend some time in person with teachers to build
rapport but then observe teachers via zoom or recorded sessions and meet
virtually. This expands the potential pool of coaches to all 50 states.
10
CRERW Table sfp_crerw_staffing_table4

District Management Group | Helping Schools and Students Thrive | www.dmgroupK12.com
45
Picus and Odden’s 2020 recalibration report demonstrates that state policy and
funding of the instructional facilitator position has a direct correlation to the
number of instructional facilitators districts hire. In order to increase the
number of instructional facilitators, therefore, the state could communicate the
value that facilitators add for students and staff by funding the instructional
facilitator position at the level indicated in the EB model.
Additionally, setting guidelines for instructional coaches can increase the
impact of instructional facilitators on teacher development. By explicitly
defining how instructional coaches should spend their time and by removing
additional duties that take away from time spent coaching staff, instructional
facilitators will support in the strengthening of Tier 1 instruction and limit the
need for interventionists and special education services outside of typical
student needs.
Master teachers and model classrooms
Improving Tier 1 instruction through a reimagined IF program can be
augmented by two other effective strategies.
Master teachers are similar to IFs but they aren't required to give up being a
classroom teachers. Many excellent teachers don't want to be IFs because they
will miss being a classroom teacher. Many principals don't want their strongest
teachers leaving the classroom either. A master teacher has a classroom but also
leaves the classroom about 5 hours a week to coach their colleagues. When they
leave the classroom is carefully planned, such as when their students are taking
tests, doing independent work, reading silently, or during project work. A
paraprofessional or other staff member covers the classroom during this time.
The master teacher will also have a lead role during faculty meetings and
common planning time. They also receive a stipend (and status) for taking on
the role.
Model classrooms are designated rooms where the teacher has been identified
as very effective. Other teachers visit the classrooms regularly through the year.
Faculty meetings and common planning time can be used to discuss the
strategies and practices seen in the model classrooms.
How is this better for students?

District Management Group | Helping Schools and Students Thrive | www.dmgroupK12.com
46
● Instructional coaching has been shown to be the most effective way to
strengthen Tier 1 instruction by building teacher capacity to meet the
learning needs of a wide range of students. All students benefit from
strong Tier 1 instruction but especially students with disabilities.
How is this better for staff?
● Instructional coaches provide the opportunity for teachers to grow in
their practice by targeting feedback and growth opportunities to their
specific needs.
● Effective coaching can reduce staff turnover by increasing effectiveness
and job satisfaction.
● Through a combination of means, teachers can increase their skill and
effectiveness.
Is this strategy more cost effective for districts and the state?
• If teachers are better able to support all learners in their classrooms, fewer
supports (interventionists, curricula, etc.) are needed outside of the
classroom, which is more cost effective for schools and districts.
Potential next steps
The state has a number of options to help improve Tier 1 instruction:
• Make the funds for IFs targeted only for IFs, master teacher stipends and
support of model classrooms.
• Conduct a study as to what separates effective IF efforts in some schools and
districts from less successful efforts elsewhere.
• Support research into effective strategies for remote coaching and/or the
expansion of part time retired coaches.

District Management Group | Helping Schools and Students Thrive | www.dmgroupK12.com
47
Opportunity #2: Clarify and expand the statewide guidance for Multi-Tiered
Systems of Support (MTSS) to include training, support, and real-life
applications for school districts.
Many schools and districts across the state and country implement tiered
systems of intervention and support through a Multi-Tiered System of Support
(MTSS) or Response to Intervention (RTI) model to provide interventions and
additional supports for students who struggle. These systems are best practice
for raising the achievement of all students, including those with mild to
moderate disabilities. The tiered intervention models use ongoing short cycle
assessments to identify student needs, targeted supports in addition to core
instruction, content experts to deliver instruction, and short cycle assessments
to progress monitor results to support student learning and prevent premature
special education referrals, which can significantly reduce demand for costly
special education services.
These systems, therefore, are an integral part of effective schools and districts as
they promote and ensure the academic and social-emotional success of students.
In Wyoming, WDE already provides guidance to school districts around MTSS
for districts to provide differentiated instruction and intervention to students.
However, school districts across the state have interpreted and implemented this
system with varying fidelity and effectiveness.
What Makes an MTSS Model Effective?
In a best practice MTSS model, schools and districts implement structures
within schools and districts that ensure consistent and ongoing use of the
model, identify students (with our without a disability) for interventions using
clear and consistent data and assessments, provide research-based interventions
in addition to core content instruction, ensure interventions are delivered by
content expert staff members, and progress monitor with short cycle
assessments the impact of those interventions. In Figure 17 below are 11
identified best practices for MTSS. In a best practice model, there must be an
organizational structure in place, strong data and assessment practices, and
supplemental interventions provided by content expert staff. These are aligned
with the best practice framework for raising achievement for students who
struggle, both with mild to moderate disabilities and without disabilities.
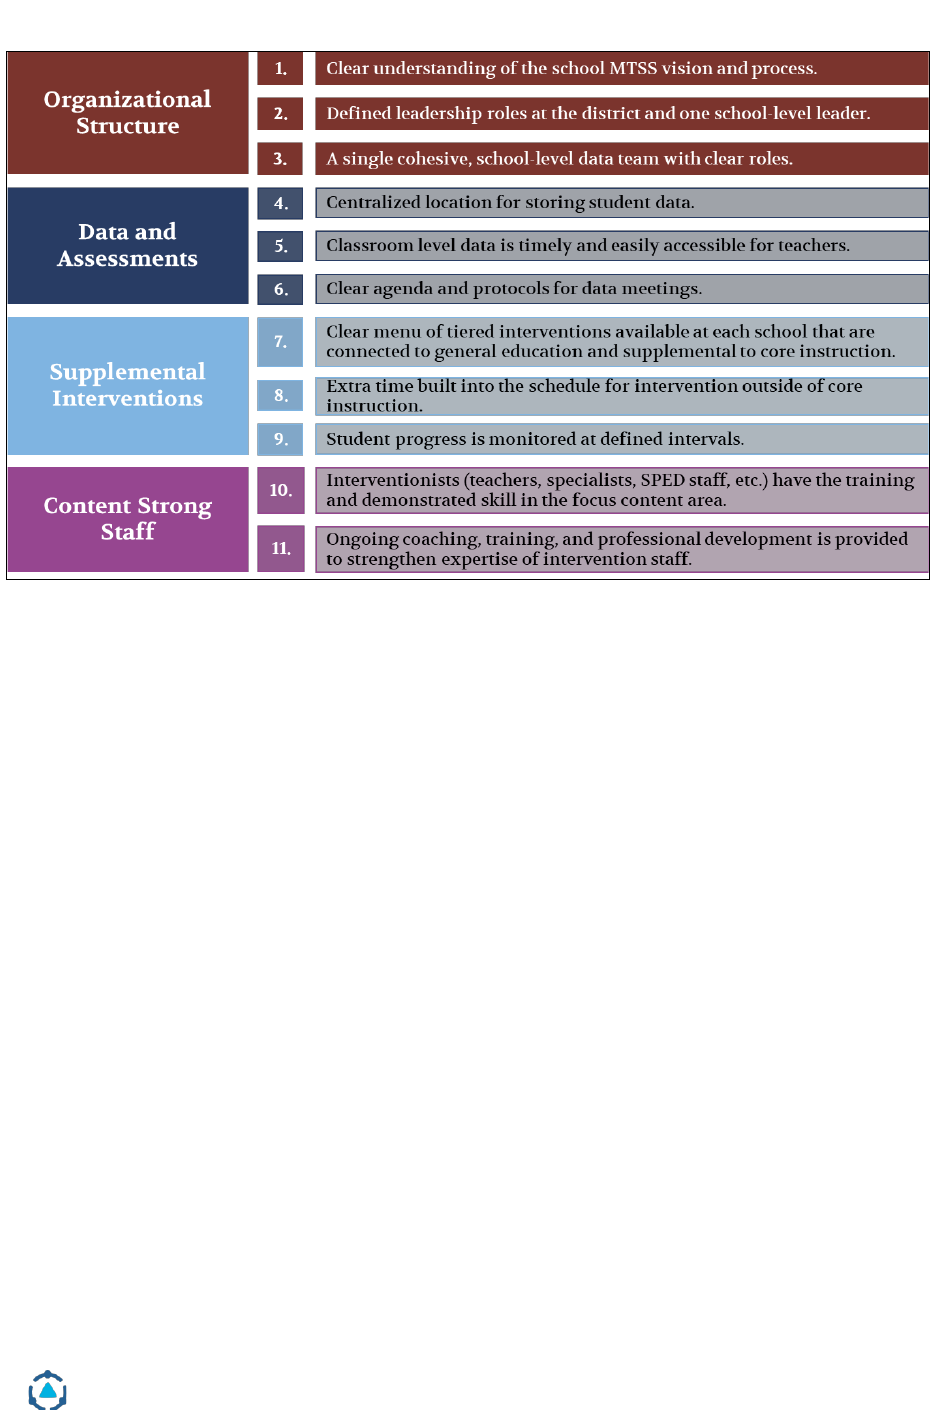
District Management Group | Helping Schools and Students Thrive | www.dmgroupK12.com
48
Figure 17. Best practices for an effective MTSS model.
Source: DMGroup.
A multi-tiered system should include three tiers defined by the types of supports
available to students. Tier 1 is differentiated instruction within the classroom
and should fully meet the needs for about 80-85% of the student body in a
district. Tier 2 interventions are short-term outside of the classroom and should
be provided to about 10-15% of the student population. Tier 3 interventions are
intensive and provided outside of the classroom. These should only be used to
support about 5% of the student population. Figure 18 shows this model.

District Management Group | Helping Schools and Students Thrive | www.dmgroupK12.com
49
Figure 18. A best practice MTSS model.
Source: DMGroup.
WDE’s guidance for MTSS is aligned with this best practice model and is focused
on preventative supports and interventions. Central to WDE’s guidance is data-
based decision making, a multi-level prevention system, strong screening
practices, and progress monitoring. Their multi-level prevention system
includes three tiers of support, including universal supports for 80% of students,
targeted interventions for 15% of students, and intensive interventions for 3-5%
of students. Their model also shows students with disabilities to receive
supports at all tiers, depending on student need. Their system is outlined in
Figure 19.
Figure 19. WDE’s MTSS model.
Source: Retrieved from Wyoming 2017 WAVE Symposium Training on MTSS.

District Management Group | Helping Schools and Students Thrive | www.dmgroupK12.com
50
Why Are the MTSS Models Across Wyoming Inconsistently Effective?
WDE provided extensive guidance, including training and resources, on MTSS.
However, districts across Wyoming had varied adoptions of the best-practice
MTSS model and fidelity of implementation. Many districts had some of the
core components of MTSS already in place. For example, most districts
interviewed had defined tiers and a shared understanding of MTSS in their
schools. Many districts also used specific data and assessments to identify
students needing Tier 2 or Tier 3 interventions and had a team of staff that
review this data and make recommendations for students. Additionally,
multiple districts visited had an intervention block in place at the elementary
level that allowed students to receive supplementary targeted interventions
from a grade-level teacher, interventionist, or other staff member and larger
districts often had tutors or interventionists devoted to providing these
interventions to students.
However, even with many of these practices in place, districts across the state
were inconsistent with their implementation of MTSS leading to varied
effectiveness. Few districts had an intervention time at the secondary level,
making it harder for students to get supplemental interventions from a content
expert. In some districts, the data used to identify students for interventions
became less substantial at the secondary level, where districts used student
grades in class rather than short cycle assessment data on specific skills. Student
grades are a blunt measure of student need and do not provide the insight need
to identify the specific skill and knowledge gaps that students need to be
successful. Additionally, many districts stated that they struggled with having
adequate interventions for Tiers 2 and 3. Teachers often cited needing more
support and training with the implementation and execution of MTSS in their
schools and classrooms.
The variation in implementation of MTSS was echoed by staff within districts
and at the state level. WDE leaders noted that MTSS remains a focus across the
state because of the inconsistency. One administrator noted, “About a third of
districts in Wyoming are doing MTSS well, about a third say they’re doing it, but
need improvement, and about a third don’t have an MTSS model.” This was even
true within districts, where some schools have a strong MTSS model in place and
others do not.
Another measure of the effectiveness of MTSS is the achievement gap between
student subgroups. Universal assessment of students needs accompanied by

District Management Group | Helping Schools and Students Thrive | www.dmgroupK12.com
51
aligned interventions delivered by content experts means that all students have
access to multiple opportunities to learn according to their learning styles and
needs. Efforts to implement an MTSS model across districts, however, have not
closed large achievement gaps, particularly between general education students
and students with disabilities (see Figure 3). Stronger systems and faithfulness
to the implementation and training needed for robust MTSS models, could help
to close those gaps.
In a medium sized district, one administrator articulated the challenge of MTSS
for her district, “It’s easy to talk in theory about MTSS tiers, but we struggle with
understanding the tools for Tier 2 and 3. There isn’t enough time to adequately
train staff and so they don’t always know the tools that work better with
different tiers or students.”
What Could the State Do to Ensure More Consistent and Effective
Implementation of MTSS Across Districts and Schools?
Every district DMGroup spoke with raised MTSS either as an area of strength or
an area of development and noted some areas in which MTSS could be
strengthened. WDE could consider refining their guidance on MTSS to include
more training, support, and real-life application of this system for districts. This
could ensure that students across the state have access to strong supplemental
interventions with content expert staff. For example, WDE could provide a pre-
approved menu of interventions for each tier, to provide guidance and options
for schools and districts on effective, research-based interventions. The EB and
Legislative Funding Models have ample resources for training, but those
resources have been underspent for over 15 years. These funds could be used to
provide this MTSS training, which would improve the overall effectiveness of
such services and could, over time, lower special education costs by lowering the
identification rates in many districts.
Additionally, the state and districts should increase the role of general education
staff and Tier 2 interventionists in the general funding model to support
students, with and without disabilities, who struggle to achieve to core content
standards through the MTSS model. The EB Model provides for a robust range of
general education staff, from tutors and Tier 2 interventionists to extended day
and summer school programs, that can provide supplemental interventions
from a content expert. If these elements of the EB Model were fully funded,
along with supports from WDE in utilizing these elements to support both

District Management Group | Helping Schools and Students Thrive | www.dmgroupK12.com
52
general education and special education students, it would allow for an
educationally effective way to both provide extra services through an MTSS
model and to lower special education costs in the long term.
How is this better for students?
• A strong, robust MTSS program in districts provides better instructional
and behavioral supports for students. In a strong program, students have
access to high quality supplemental interventions from a content expert
in addition to strong core instruction. Strong MTSS practices are research
backed and help lead to increased student achievement.
• Current efforts to implement MTSS models have not closed a large
achievement gap between general education students and students with
disabilities. Consistent implementation of an MTSS model could help to
close those gaps.
• An effective MTSS system could also improve the identification process
for students with disabilities by ensuring that multiple interventions are
afforded to the student before they are referred to the evaluation process.
Is this strategy more cost effective for districts and the state?
• A strong MTSS program is a cost-effective way of supporting students and
schools. The components of an effective MTSS model – intervention
blocks, short cycle/formative assessments, teams to analyze data – cost
little for the district to implement, and resources to do so are included in
both the EB and Legislative Models. Additionally, schools can take
advantage of existing staff with content expertise and adjust scheduling
to ensure these are the teacher who are providing interventions to
struggling students, which increases the quality of instruction for
students but does not add personnel costs to the district.
• Effective MTSS models validate the identification process for special
education as it provides interventions and additional supports for
struggling students before they are referred and evaluated for special
education services. In many districts in Wyoming, this will reduce the rate
of identification for special education, decreasing the need for costly
special education services.

District Management Group | Helping Schools and Students Thrive | www.dmgroupK12.com
53
Opportunity #3. Ensure that students with academic needs receive best practice
intervention including extra instructional time provided by content strong staff.
In the 2018-19 school year, there was a significant achievement gap between
students with and without IEPs in Wyoming (see Figure 3). While 58% of all
students across the state scored proficient or higher on the WY-TOPP
assessment, only 19% of students with IEPs were proficient. School districts have
taken this gap seriously and have made significant investments to close the gap,
but with limited success.
Co-teaching has become a popular approach for trying to close the achievement
gap in Wyoming districts. Research shows that co-teaching has inconsistent
results given the number of critical conditions that must be met in order for the
strategy to be effective. Additionally, it is a resource heavy model because it
requires two certified staff to teach one group of students.
Research indicates that having extra time intervention during the day to pre-
teach and reteach core content to struggling students is one of the most effective
strategies for closing the achievement gap.
11
Given the limited time during a
school day and the complexities of scheduling required for both co-teaching and
extra time intervention, however, districts and schools find it challenging to
invest in both strategies simultaneously and often choose to implement the co-
teaching model alone.
Districts across Wyoming used a number of strategies to raise student
achievement, particularly for students with disabilities. One of the strategies
used most, particularly in medium and large districts, was co-teaching. As
shown in Figure 20, special education teachers across Wyoming spent about 20%
of their time with students in co-taught settings. The percent of time teachers
spend in this setting increased as districts increased in size, with large district
teachers having spent over a quarter of their time with students in co-taught
settings. During focus groups, staff expressed optimism that this strategy would
raise the achievement of students with disabilities in an inclusion setting. Some
staff noted that the model has been successful, especially at the secondary level,
in shrinking the performance gap on formative assessments between students
with and without disabilities. Others spoke to its success in encouraging the
least restrictive environment (LRE) by “bringing special education into the
11
John Hattie’s Visible Learning Research. Findings on the effectiveness of RTI.
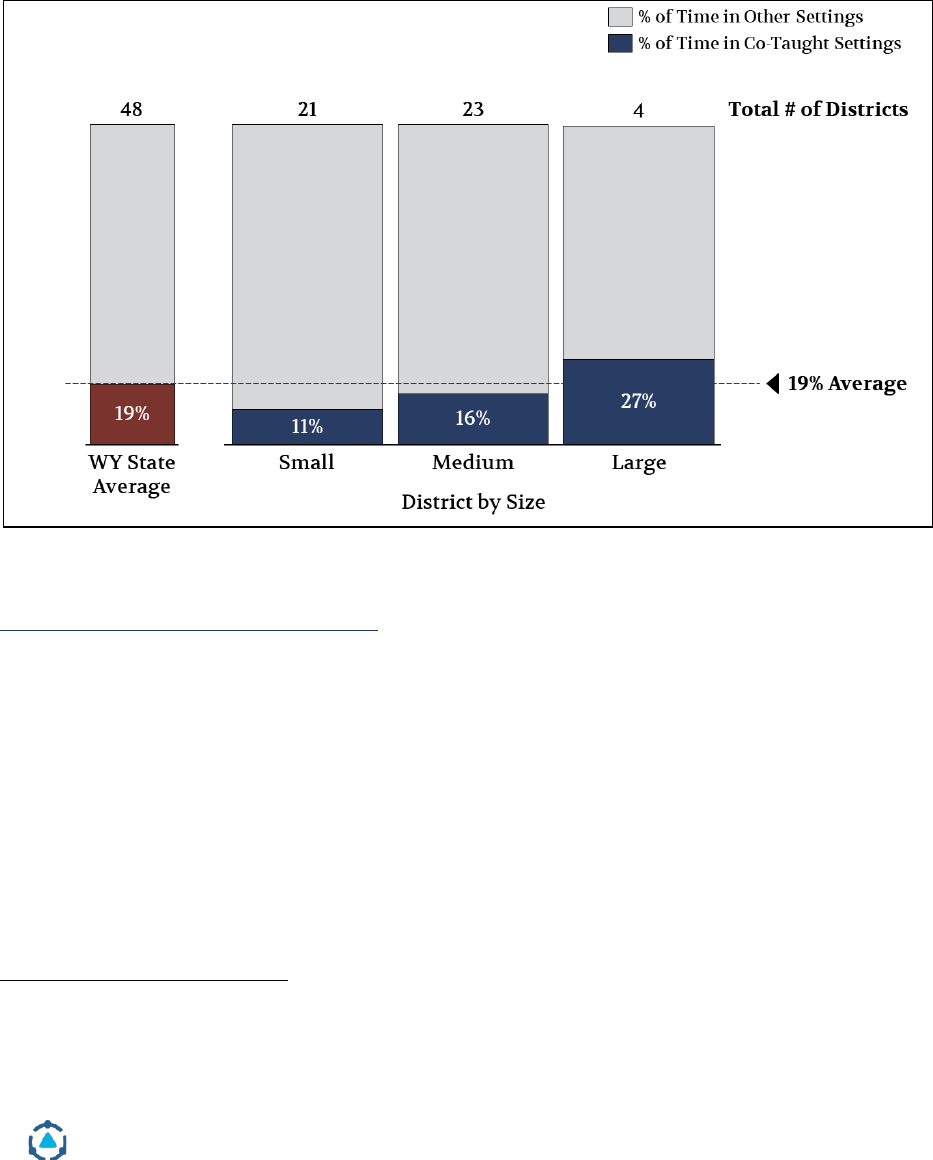
District Management Group | Helping Schools and Students Thrive | www.dmgroupK12.com
54
[general education] classroom.” Staff expressed particular confidence in the
model when co-teaching was paired with common planning time and targeted
professional development. However, the data on the large achievement gap
between students with and without a disability counters these perceptions about
the effectiveness of co-teaching.
Figure 20. Percent of special education teacher time in co-taught settings.
Source: Schedule sharing data.
The Challenge with Co-Teaching:
Co-teaching is an expensive model with inconsistent and often discouraging
results based on national studies. A landmark study by John Hattie found that
co-teaching, on average, leads to significantly less than a year’s growth each
year, which is a low bar for struggling students who need to make more than a
year’s growth to catch up to grade level.
12
A 2012 meta-analysis of 146 studies
showed no causal evidence that co-teaching improves student achievement and
12
Levenson, Nathan. Six Shifts to Improve Special Education and Other Interventions.

District Management Group | Helping Schools and Students Thrive | www.dmgroupK12.com
55
a recent study in Massachusetts found that co-teaching had no effect on
students with disabilities’ performance in ELA or in Math.
13
Co-teaching alone often fails to raise achievement in schools and districts for
two reasons:
(1) Effective co-teaching requires meeting a number of prerequisites that
schools are often unable to meet, and
(2) Co-teaching does not provide extra-time beyond core instruction for
intervention, which is critical for raising the achievement of struggling
students. Most districts do not have the resources – time, money, and staff
– to implement both co-teaching and additional intervention time.
As outlined in Figure 21, for co-teaching to be effective, it requires that the
partnered general education and special education teachers have four key
elements (1) common training and professional development, (2) explicit time
for daily co-planning, (3) shared content expertise, and (4) a strong relationship
(which can be aided but not entirely controlled by school culture). Across
Wyoming districts, DMGroup heard that some of these conditions were in place.
For example, one district sent co-teaching partners to a training together over
the summer. In another district, one high school had carved out time during the
day for co-teachers to lesson plan together. However, it is unusual for school
districts to be able to meet all four of these conditions and school districts in
Wyoming are no exception; very few districts in Wyoming had all of these
required structures in place.
Few Wyoming districts provided general education teachers and special
education teachers the same training, especially on the topic of co-teaching.
Some district leaders noted the intent to send co-teaching teams to trainings, but
few had done so. For those districts that had sent teachers to co-teaching
trainings, it was almost always special education teachers who went to the
training alone. Additionally, general education teachers and special education
teachers were often part of separate professional learning communities (PLCs),
which is where department staff typically collaborated and developed content
knowledge. A group of general education teachers from one district noted that
even though special education teachers were invited to their department
13
Jones, Nathan, Vaughn Sharon, and Fuchs Lynn. Academic Supports for Students with Disabilities.
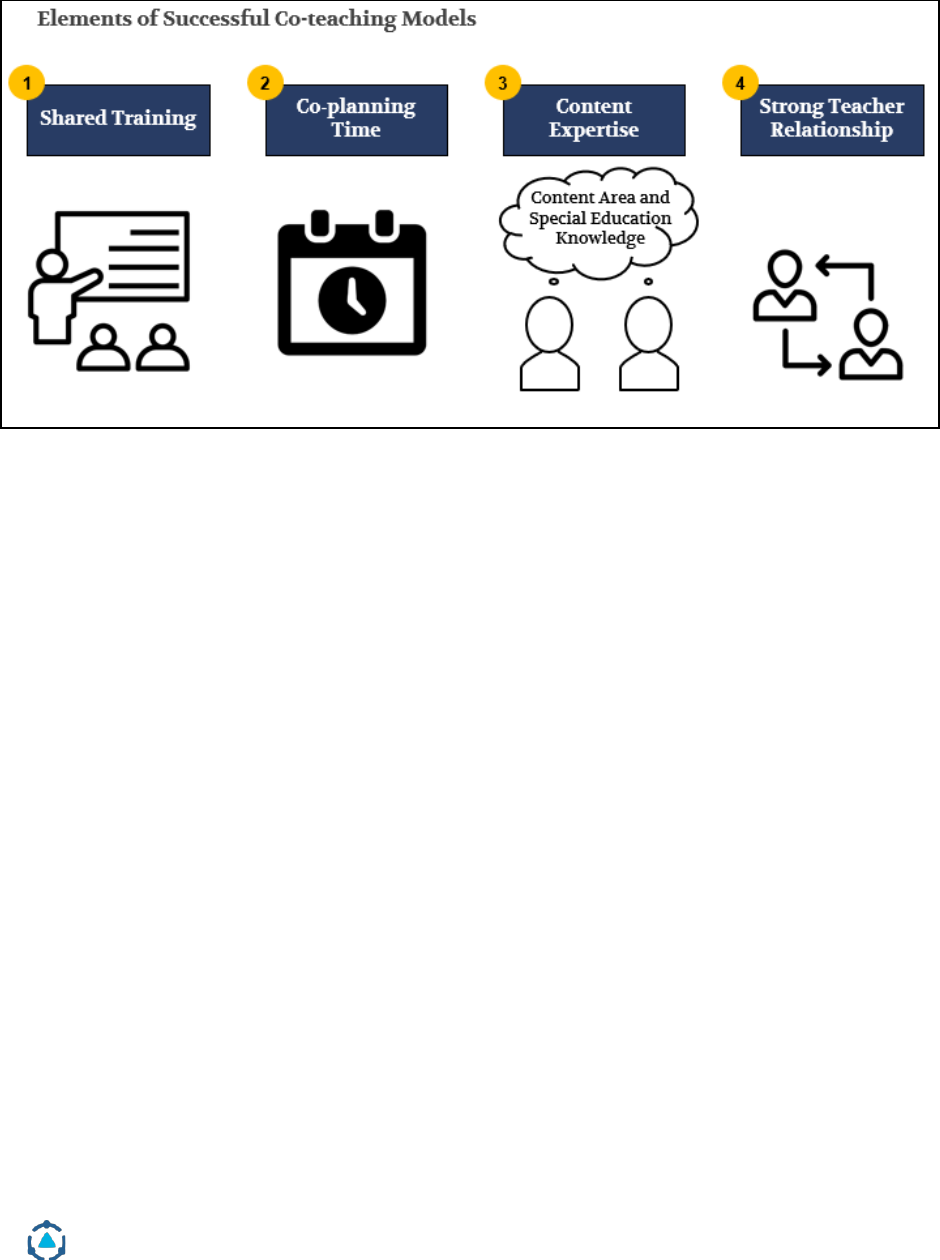
District Management Group | Helping Schools and Students Thrive | www.dmgroupK12.com
56
meetings, they often could not attend because the time conflicted with IEP
meetings or their own department meetings.
Figure 21. Elements of successful co-teaching models.
Source: DMGroup.
In addition to the challenge in finding shared time for training and
development, district leaders and staff noted the challenge in finding common
daily planning time for co-teachers. Teachers and special education directors
alike noted the challenge in building time into the schedule for co-planning.
One group of high school teachers added that even when they did find some
time for co-planning, special education teachers were often double booked to
attend IEP meetings or to pull students for services. In part due to this missed
opportunity to collaborate, special education teachers often played a supportive,
rather than equal, instructional role in the classroom. Some special education
teachers expressed feeling like a “glorified paraprofessional” in co-taught
classrooms, either because the general education teacher took the lead on lesson
delivery or due to a lack of content expertise by the special education teacher.
Finding special education teachers who have context expertise in the subject
they are co-teaching is another requirement that was challenging for districts in
Wyoming – as well as other states – to meet. “In an ideal co-teaching model,”
noted one teacher, “there are two certified teachers in the classroom, and you
can’t tell who the expert is in either area of expertise [content or special
education].” District leaders across Wyoming, especially those farther from the
larger cities like Cheyenne or the University in Laramie, noted the challenge in

District Management Group | Helping Schools and Students Thrive | www.dmgroupK12.com
57
finding enough highly skilled special education teachers, let alone special
education teachers with subject matter expertise. One medium-sized district was
working to specialize their special education teachers at the secondary level for
this purpose, but the process was slow and difficult. A group of high school
teachers shared that their school had started with co-teaching only in ELA and
Math and that they wished to expand co-teaching to other subjects, but they
didn’t have enough staff, particularly those with required content expertise.
In addition to the need for shared training, co-planning, and content expertise,
effective co-teaching is heavily dependent on the relationship among co-
teaching partners. These relationships are strengthened over time when
partners have multiple opportunities to work together. Staff in focus groups
expressed that the best co-teaching existed when partner teachers had co-taught
together for multiple classes and multiple years. However, scheduling
challenges often got in the way of keeping partners together year over year.
Teacher turnover, especially on the special education side, also posed a
challenge to building co-teaching relationships over time.
The challenge in ensuring all of these four conditions are met within each co-
teaching classroom created inconsistencies in impact across the state and even
within districts and schools. During a visit to a high school in a large district,
DMGroup observed two co-teaching classes. In the first, both adults in the room
shared the instruction and supported students equally during work time. It was
unclear which adult was the general education teacher and which was the
special education teacher both in terms of their content knowledge and their
role during the lesson. In the next classroom, the general education teacher led
the entire lesson while the special education teacher stood in the back. During
work time, the special education teacher only supported the students with
disabilities in the room, making a statement about who each teacher was in the
room to support.
What is a Best Practice “Extra-Time” Intervention Model?
Even if school districts invest to meet all of the required conditions, co-teaching
often precludes providing extra time in the schedule for interventions, which, as
outlined in the best practices section of the report, is critical for closing the
achievement gap for students who struggle. The extra time model builds into
the daily schedule a block of time specifically for context experts to provide pre-
teaching, reteaching, teaching specific skill gaps, or extra practice to ensure

District Management Group | Helping Schools and Students Thrive | www.dmgroupK12.com
58
struggling students have the opportunity to master core grade level content.
Research states that struggling students require 30 minutes per day at the
elementary level and 45-60 minutes per day at the secondary level of extra time
outside of core instruction in order to close gaps in learning.
14
This model is critical for struggling students including students with mild to
moderate disabilities and has proven to be an effective strategy for closing
achievement gaps as long as content strong staff are the ones supporting
students during this time. Thoughtful scheduling of extra-time intervention
blocks also ensures that the students who struggle most have increased
opportunities to work with content strong staff who are skilled at identifying
and correcting misconceptions and teaching content using multiple modalities.
Some special educators are content expert staff, some are not. Nearly all general
education staff have content expertise.
General education staff, including literacy specialists, math specialists,
interventionists, and classroom teachers are often the content experts best
equipped to provide interventions for students with and without disabilities.
Since certification is not always a reliable indicator of who is or is not an
effective teacher of reading and math. In a best practice model, districts use
coursework, training, and past results to identify these content experts in their
schools. The EB model seeks to provide resources for content experts through
general education resources, including core tutors and at-risk tutors.
Many elementary schools in districts across Wyoming had extra-time models
with intervention blocks built into their schedules, but this is more unusual at
the secondary level. Even schools that did have extra-time intervention blocks
did not always have content experts providing interventions to students with
disabilities. The approach and staff during this extra time was often based on
special education status. For example, a teacher in one district noted that during
intervention times, “The team of interventionists push in by grade level and
support Tier 2 students. At the same time, special education teachers pull out
their students to work on IEP goals.” She noted that “special education students
are not usually in the intervention groups,” so students with IEPs received
intervention from special education teacher generalists instead of the content
expert interventionists or grade level teachers. While most special education
teachers are strong advocates for the needs of students with disabilities, and
14
John Hattie’s Visible Learning Research. Findings on the effectiveness of RTI.

District Management Group | Helping Schools and Students Thrive | www.dmgroupK12.com
59
have much expertise in pedagogical practices, many have limited background in
the teaching of reading, math, or other subjects. Some certainly do have content
expertise, but not all, and not even a majority.
While co-teaching enables students with disabilities to engage in the general
education classroom with their peers and often includes a variety of
instructional strategies that allow for students to access core content, it “does
not work well for helping students fill gaps,” as one elementary special
education teacher explained. In order to fill gaps in knowledge or scaffold
upcoming lessons to prevent gaps from developing, additional learning time
from a content expert outside of core instruction is essential.
What Could Wyoming Districts Do Differently?
Students would benefit if elementary and secondary schools included extra time
in their master schedules for struggling students to learn past material and get
extra help for current material during intervention periods and classes.
Wyoming districts can continue to invest and develop their co-teaching models
in addition to, not instead of, extra time during the day for intervention. If
school schedules or staffing prohibit the scheduling of both co-teaching and
extra time intervention blocks, Wyoming districts would better serve students
by investing in extra time. This strategy supports the learning and achievement
of students who struggle more directly and consistently than co-teaching. In
these extra time models, Wyoming districts should ensure that students who
struggle, with and without disabilities, have access to the content experts who
can identify missing foundational skills, correct misconceptions, pre-teach
concepts, re-teach concepts, or break down complex ideas in a way that is more
accessible.
In addition to the benefit of the extra-time intervention model on student
learning, the extra-time intervention model costs the same or less than a co-
teaching model.
In a typical elementary co-teaching classroom, there are a handful of students
with mild-moderate disabilities with varying academic and behavioral needs.
Imagine, for example, a class with three students with IEPs – one with a math
goal, another with an executive functioning goal, and the last with reading
difficulties. The special education teacher helps deliver the content and provides
individual accommodations for those three students for say 1 hour a day while
the classroom teacher covers the core content. In an extra-time intervention

District Management Group | Helping Schools and Students Thrive | www.dmgroupK12.com
60
model, however, that same special education teacher (or general education
teacher) would provide instruction in those three areas of need but can group up
to 5 students from different classes for an hour with similar needs to provide
more targeted instruction to more students.
In this example, the extra-time intervention model is more cost effective and
provides high-quality instruction, an extra hour of instruction each day, to more
students.
Assume the special education teacher costs the district $90,000 including
benefits. In the co-teaching model, the per pupil cost to serve those 3 students is
$6,000 (assuming 5 hours are devoted to teaching each day). In the extra time
model with 5 students in each group, the per pupil cost is only $3,600. Not only
is the per pupil cost lower, but the special education teacher is able to deliver
quality instruction to more students. The help is more targeted, and more time
to learn is provided as well.
The same trend happens at the secondary level. In a co-teaching model, a special
education teacher may co-teach three classes each with five students with IEPs
and one resource class with 5 students, serving a total of 20 students during the
day. If, instead, that teacher taught four extra time math classes with 10
students, the same teacher would be able to provide quality instruction to 50%
more students. Assuming the same $90,000 cost to the district, the per pupil cost
of students served is half the amount ($2,250 versus $4,500) in the extra-time
model than in the co-teaching model.
If Wyoming districts choose to continue in utilizing co-teaching alongside the
scheduling of intervention periods, districts are advised to implement the best
practice conditions that are necessary for effective co-teaching – common
training, co-planning time, shared content expertise, and strong relationship –
to increase the consistency and impact of the model.
Why is extra-time better for students?
● In a co-teaching model, the special education teacher can provide
modifications so that students with mild to moderate disabilities can
access the core content but does not provide the time to address any prior
knowledge gaps that would strengthen the students’ ability to succeed
with the grade level content. For example, the special education teacher
may be able to scaffold the steps of a long division problem but does not

District Management Group | Helping Schools and Students Thrive | www.dmgroupK12.com
61
have the time in a co-teaching environment to provide that student
practice with the multiplication and subtraction skills that undergird
proficiency with long division. The extra-time intervention model, on the
other hand, provides time for a content expert to fill those past knowledge
gaps so that the student can also learn about long division alongside their
peers in the general education classroom.
● Creative scheduling maximizes opportunities for students who struggle
to spend more time with content strong staff who are skilled at
identifying and correcting misconceptions and teaching content using
multiple modalities.
● Co-teaching does not provide time outside of core instruction for
intervention, which is critical for closing achievement gaps for struggling
students.
● Co-teaching has inconsistent results for students because it depends on
many conditions being in place to be effective, some of which are hard to
ensure at scale.
Why is extra-time better for the budget?
● The extra-time intervention model allows special education staff to
provide quality instruction to more students at a lower per pupil cost. For
example, while in a co-teaching class, a special education teacher may
provide support to five students with IEPs. However, during an extra-time
intervention block, that same teacher could pull three small groups of 5
students each with similar needs, providing quality instruction to three
times the number of students at a third of the per pupil cost.
Potential next steps
The state could facilitate the adoption of this best practice in a number of ways.
• Make the funds for interventionists and high skilled tutors targeted only
for these roles.
• Simplify and encourage reimbursement for general education
interventionists and high skilled tutors when they serve students with
disabilities.
• Provide statewide technical assistance in scheduling and staffing of best
practice interventions.

District Management Group | Helping Schools and Students Thrive | www.dmgroupK12.com
62
Opportunity #4: Refine the role of paraprofessionals to focus on health, safety,
behavioral, and severe needs, rather than academic support.
Paraprofessionals often provide critical supports to students with disabilities.
However, there was a statewide tendency to over rely on paraprofessionals,
particularly to support student academic instruction. In the 2018-19 school year,
Wyoming employed the equivalent of 1,760 full time special education
paraprofessionals for a total cost of about $60 million. In small districts,
certified special education staff were stretched thin across multiple roles and
hard to hire so paraprofessionals were tasked with many different
responsibilities that certified staff were unable to cover, including instruction to
students with mild to moderate disabilities. In larger districts, limited guidance
from district and state leaders on the role of the paraprofessional led to a wide
variation in roles of paraprofessionals across districts and schools.
Over the last decade two truths have emerged. 1) Research is clear that
paraprofessionals are important for supporting students with disabilities, but
not their academic needs as they often don’t have the training, certification, or
content expertise to provide grade level instruction to students
15
and 2) despite
this research, the role of paraprofessionals in providing academic support has
increased in many districts, including in Wyoming, contributing to the stubborn
achievement gap between student with disabilities and their non-disabled peers.
Paraprofessional support is most effective when focused on the health, safety,
behavior and severe needs of students with disabilities. Unfortunately,
paraprofessionals in many districts received little guidance and training on
these key responsibilities which perpetuated confusion around their role,
accounted for the range in quality of their support to students and may have led
to high turnover rates.
The Challenge with Relying on Paraprofessionals to Support Student Instruction
Non-certified special education staff play an important role in supporting many
students with special needs, especially for health, safety, behavioral and
15
Mittnacht, Marcia. “Technical Assistance Advisory SPED 2014-3: Identifying the Need for
Paraprofessional Support.” Massachusetts Department of Elementary and Secondary Education. February
26, 2015.
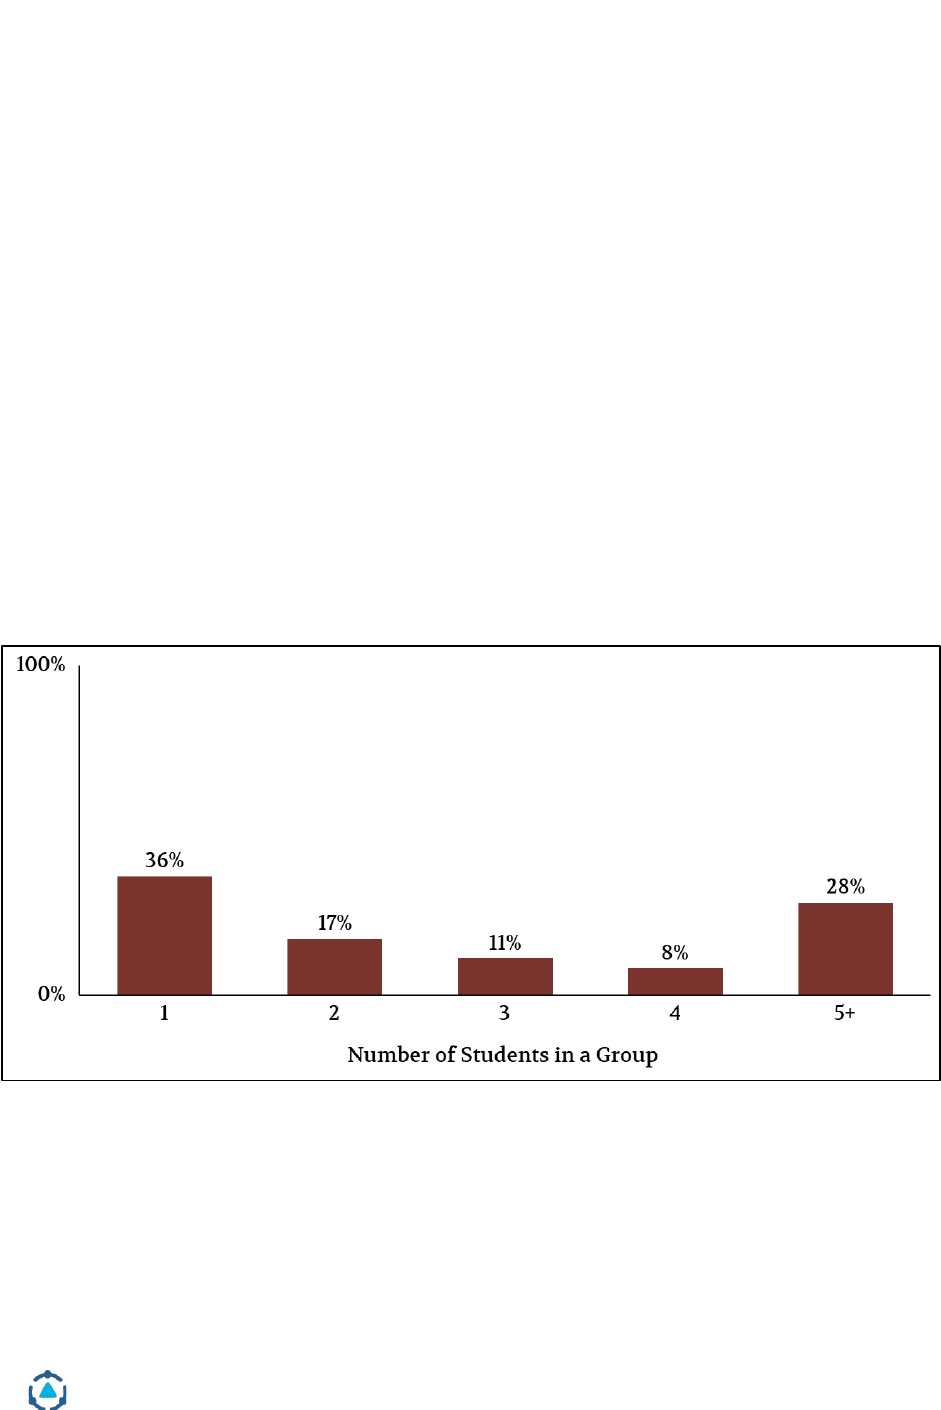
District Management Group | Helping Schools and Students Thrive | www.dmgroupK12.com
63
physical support. For many students with severe disabilities, support from
paraprofessionals is indispensable for enabling the students to successfully
participate in school each day and take maximum advantage of inclusion.
When students with mild to moderate special needs struggle academically, it is
more beneficial for them to spend extra time with certified teachers or
interventionists highly skilled in the teaching of reading or academic content
areas than with paraprofessionals, who typically do not have extensive training
in the teaching of reading or core content areas.
Moreover, the overuse of paraprofessional support for some students can often
limit students’ learning and independence, particularly when they work with
students one-on-one. For students with mild to moderate needs, too much
paraprofessional support can result in limiting a student’s interactions with the
classroom teacher and other students and maintain a need for continued or
elevated paraprofessional support. Figure 22 illustrates that in Wyoming
districts, paraprofessionals spent almost 40% of their time working one-on-one
with students, increasing the likelihood for long-term dependence.
Figure 22. Percent of paraprofessional time with students by group size.
Source: Schedule sharing data.
Paraprofessionals generally do not have the certifications nor are they included
in the staff meetings that would allow them to provide high-quality academic
support to students. Nonetheless, paraprofessionals are often expected to
provide academic support – and, at times, instruction – to students in the
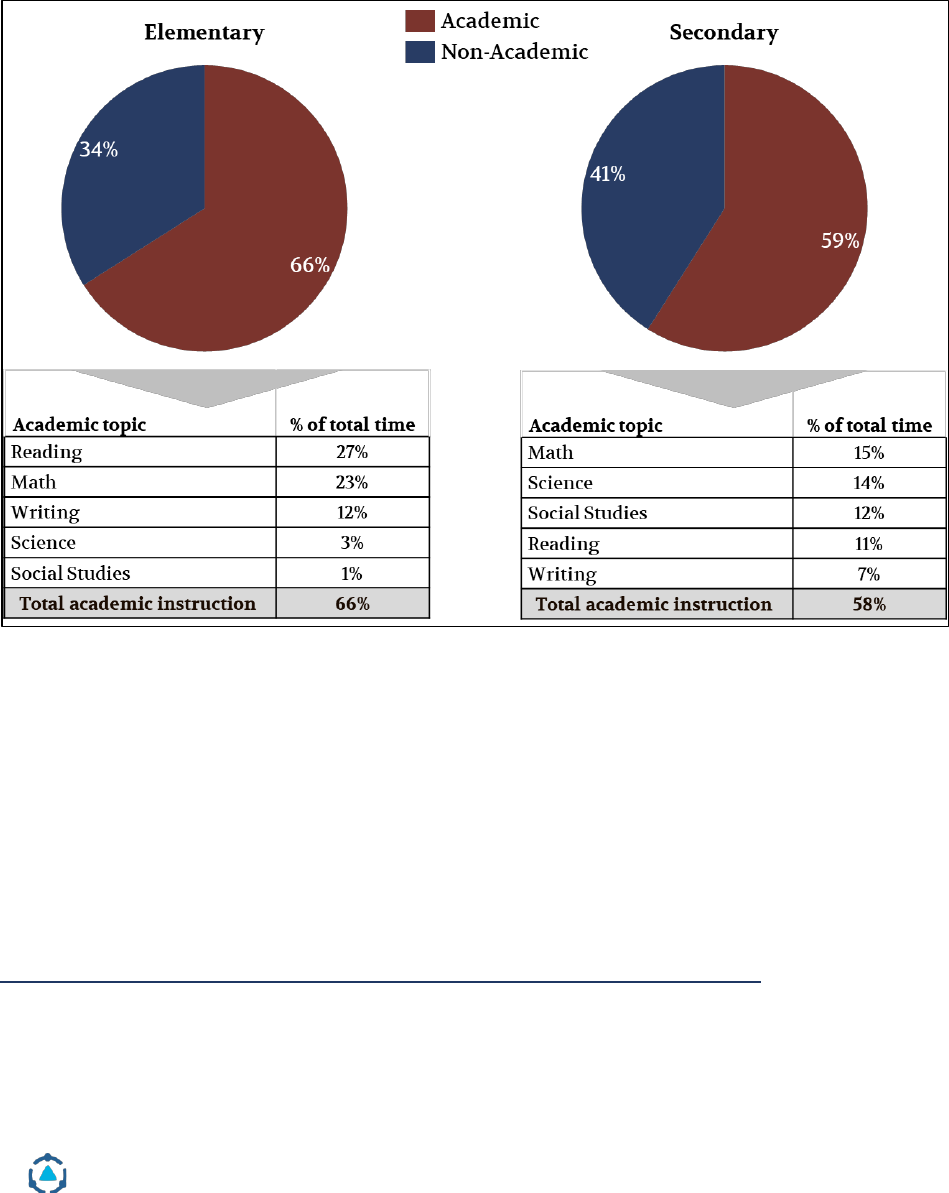
District Management Group | Helping Schools and Students Thrive | www.dmgroupK12.com
64
classroom. According to schedule sharing, elementary paraprofessionals and
secondary paraprofessionals spent 66% and 59%, respectively, of their time with
students, supporting them on academic topics, at least half of which was spent
on reading and math (see Figure 23).
Figure 23. Percent of paraprofessional time with students by topic and subject.
Source: Schedule sharing data. Staff at K-8 and K-12 schools are included in both elementary and
secondary analyses.
Moreover, paraprofessionals were often not invited to instructional staff
meetings (PLCs, staff meetings, trainings, etc.) because they occur outside of
their contracted hours. One paraprofessional explained that they were expected
to provide instructional support to students but missed the opportunities for
collaboration that would make their support more effective. “I work so hard to
be consistent,” she commented, “but not everyone is always on the same page.”
Why Do Wyoming Districts Use Paraprofessionals for Instruction?
In small districts, there was a reliance on paraprofessionals to provide academic
instruction to students, because certified roles were stretched too thin. In one
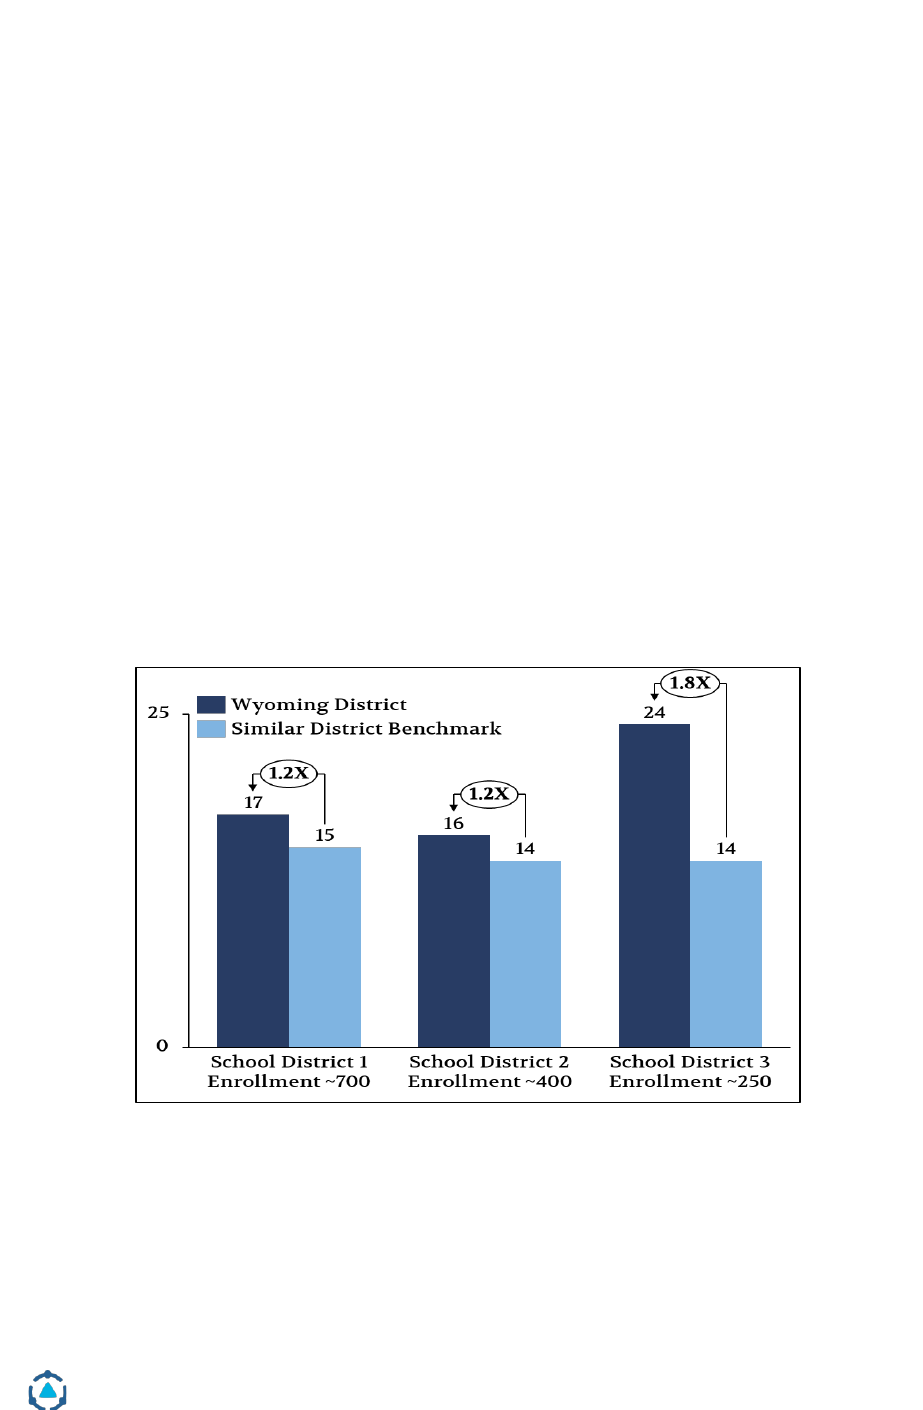
District Management Group | Helping Schools and Students Thrive | www.dmgroupK12.com
65
district, there was only one special education teacher for the elementary school
and one special education teacher for the middle school, so the district relied on
paraprofessionals to provide the support that the teacher could not. One special
education teacher said, “Providing services without paraprofessionals would be
impossible, they are responsible for so many accommodations.”
The need for paraprofessionals to take on some of the responsibilities of
certified staff has led to large numbers of paraprofessionals in these districts.
Figure 24 below shows three small Wyoming districts had between 1.2 and 1.8
times as many paraprofessionals than benchmark districts. Benchmarking came
from a database of districts nationwide and were adjusted based on enrollment,
per pupil spending, special education identification rates, and poverty level.
Three districts of varying sizes are represented in the chart. On average, small
districts across Wyoming had 1.4 times more paraprofessionals per 1,000
students than DMGroup’s benchmark districts (see Figure 25). There were only
two small districts across the state that had fewer paraprofessionals than
benchmark districts, adjusted for enrollment.
Figure 24. Three Wyoming small districts paraprofessional staffing compared
to benchmark districts.
Source: District and WDE staffing data. District staff benchmarking from DMGroup proprietary
database of districts nation-wide. Similar districts exhibit similarities in per pupil spending, poverty
level, special education identification rate, and student enrollment. Please note that any benchmarking
is directional and is not a staffing recommendation.
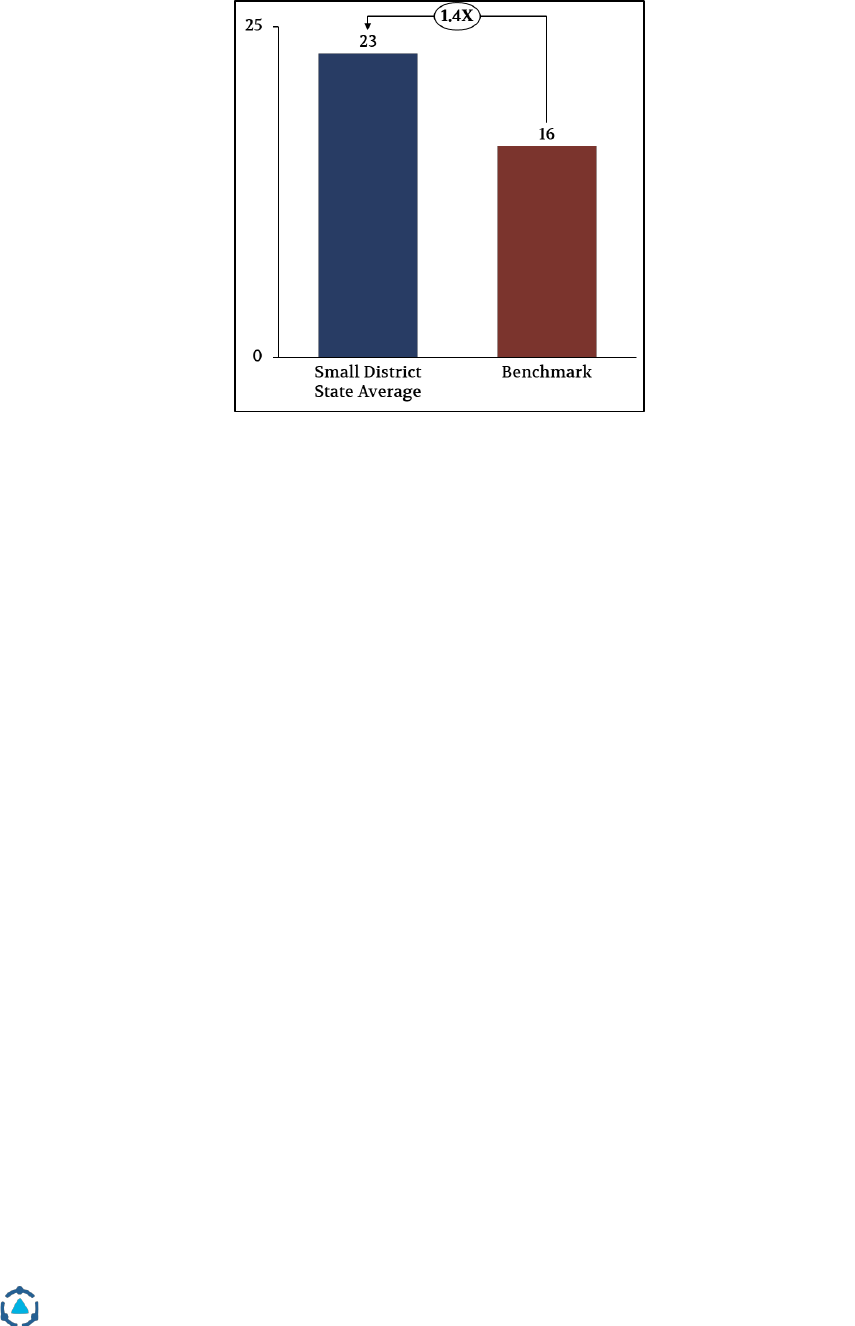
District Management Group | Helping Schools and Students Thrive | www.dmgroupK12.com
66
Figure 25. Wyoming small district average paraprofessional staffing compared
to benchmark districts.
Source: District and WDE staffing data. District staff benchmarking from DMGroup proprietary
database of districts nation-wide. Similar districts exhibit similarities in per pupil spending, poverty
level, special education identification rate, and student enrollment. Please note that any benchmarking
is directional and is not a staffing recommendation.
In larger districts, paraprofessionals wore many hats, including providing
academic instruction, in part because their role was not clearly defined or
understood. Through focus groups, DMGroup learned that paraprofessionals
were used to support students on behavior coaching and redirection, to pre-
teach and reteach content to students, to provide 1:1 support for students with
more intensive needs, and were often assigned to or pulled for school duties or
classroom coverage. Based on schedule sharing data in Figure 26,
paraprofessionals in large and medium districts spent about 58% of their time
on student support, 14% on instruction, and 9% on school duties. A group of
middle school paraprofessionals noted that “when a teacher knows the role of a
para, it can be great, but usually the teacher just doesn’t know the role of the
para.” In another district, elementary paraprofessionals lamented that
administrators don’t understand their role, which often makes them feel
dispensable.
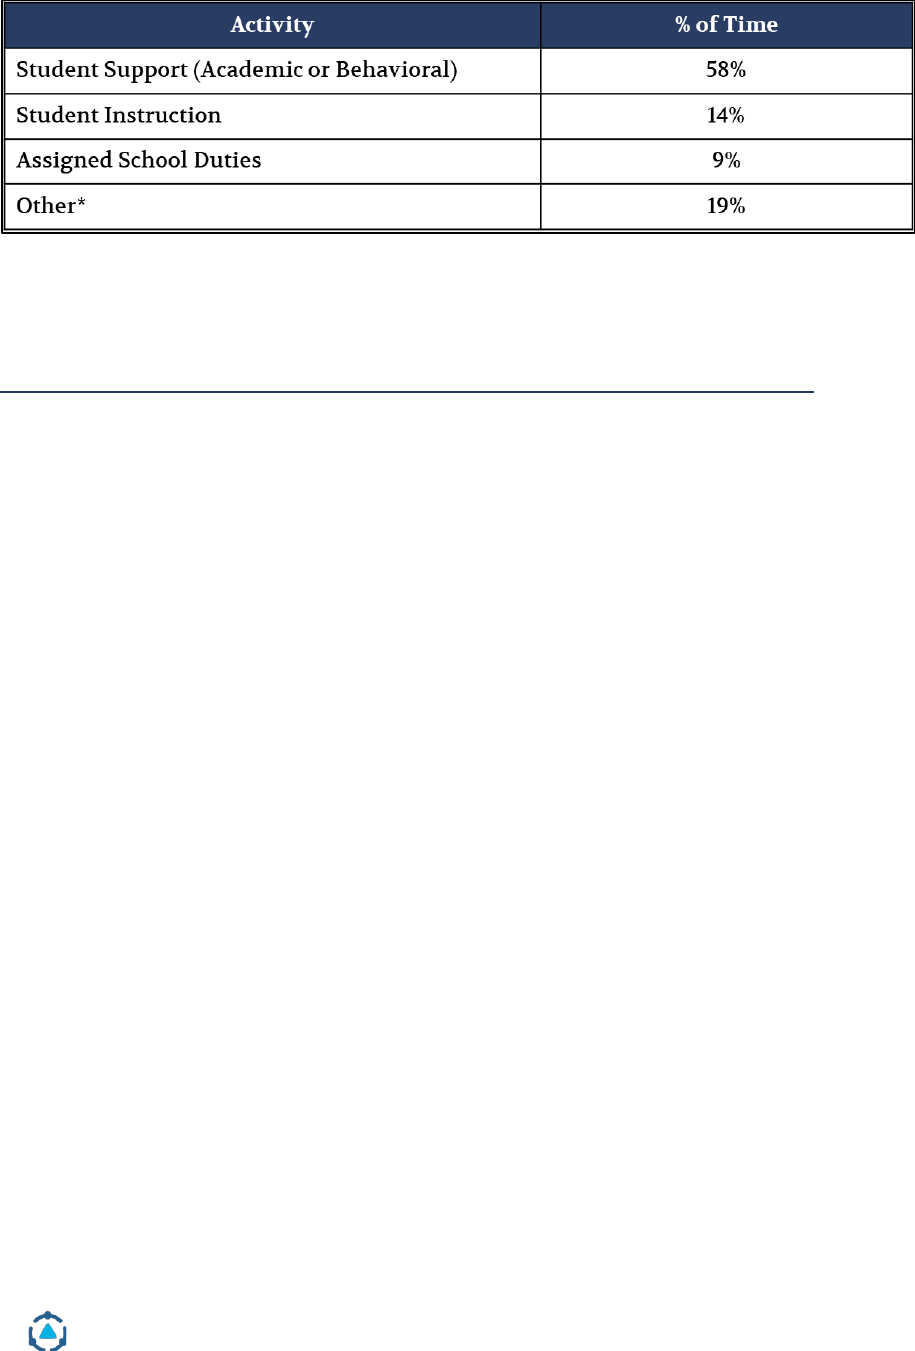
District Management Group | Helping Schools and Students Thrive | www.dmgroupK12.com
67
Figure 26. Percent of paraprofessional by activity.
Source: Schedule sharing data. *Other includes: Personal lunch, planning/materials preparation,
collaboration with colleagues, data collection/management, professional development, paperwork,
parent communication, travel between schools/transition time, and over/under reported time.
The Impact of Limited Training on Supports to Students and Retention
Paraprofessionals provide the greatest benefit to students when they offer
health, safety, and behavior support to students coupled with targeted training
and opportunities to collaborate with classroom teachers. Multiple groups of
paraprofessionals across districts, however, expressed that there is little to no
training before their first day on the job. One paraprofessional explained, “there
really is no training… you just show up and wing it. If you have a love for
children, that helps.” A group of middle school paraprofessionals noted a need
for more training on behavior support for students as they are often not invited
to those trainings. “The expectation is that the teachers will come back and train
us, but they don’t have time for that,” they explained. Paraprofessionals often
did not participate in professional development days because they are outside of
their contract and are not offered compensation to attend. According to schedule
sharing, paraprofessionals spent only 0.1% of their time receiving professional
development.
When training was offered to paraprofessionals, it was usually only at the
beginning of the year. Ongoing training was often limited and self-directed or
directed by the special education teachers. One paraprofessional from a
medium-sized district noted that there used to be more training for
paraprofessionals. “That’s why I’m good at what I do,” she explained, “but now I
have to look for the training opportunities and invite myself.” Paraprofessionals
in other districts, however, were not included in staff training, even when they
asked to join. “We’re told the schools don’t have the funding for us to attend....it
makes me feel behind on my ability to support students.”

District Management Group | Helping Schools and Students Thrive | www.dmgroupK12.com
68
As a result, teachers noted that the quality of paraprofessional support was
almost completely based on their background and experience before entering
the district, not their on-the-job training, which led to a wide range in the quality
of the support they offer students. For example, some paraprofessionals were
certified teachers while others only had a high school diploma; this has led to
wide variation in their effectiveness with students.
A lack of guidance and training often led to high turnover rates among
paraprofessionals and inconsistency for students. One district leader noted that
their biggest turnover rates were among paraprofessionals. He explained that
“there are a core of about 10-15% of paraprofessionals that stick around but the
rest of them turn over pretty quickly...usually within every four years.”
Unfortunately, there was no reported data on statewide turnover rates for
paraprofessionals but conversations with school leaders and staff across all of
the districts DMGroup spoke with, echoed similar experiences with high
turnover rates among paraprofessionals.
There were a variety of reasons shared to explain short paraprofessional tenures
including low pay, feeling undervalued, and experiencing burnout. However,
staff and school leaders shared that if paraprofessionals received more training
and were given a clearer role in the classroom, they would be inclined to stay in
their positions longer. A teacher expanded on the impact of the turnover on
students. “We see a lot of paras come and go...which leads to a lot of
inconsistency for students.”
What Could Wyoming State Leaders and Districts Do Differently?
The state and districts could consider shifting the responsibilities of
paraprofessionals to focus on health, safety, and behavior needs as well as
supporting students with severe needs by developing explicit guidelines on
paraprofessional responsibilities and by offering additional training
opportunities. Moreover, districts could backfill paraprofessional positions with
certified staff to better meet the academic needs of students with disabilities.
In order to provide students with content strong teachers, paraprofessionals
should decrease their time supporting students on academic topics and narrow
their focus appropriately on health, safety, behavior, and severe need supports.
Additionally, the state should encourage districts to offer more training to
paraprofessionals by developing and sharing training modules, topics, and

District Management Group | Helping Schools and Students Thrive | www.dmgroupK12.com
69
materials with districts to utilize with paraprofessionals. The EB model funds
professional development at high levels and can be used to increase training
resources and opportunities for paraprofessionals at the district level.
As general education teachers take on more academic intervention, the number
of paraprofessionals needed will decrease. Though this recommendation does
not suggest letting go of paraprofessional staff in any district, through natural
attrition, districts can backfill vacant paraprofessional positions with content
strong staff who are best equipped to support student learning. While certified
staff are more costly than paraprofessionals, they can provide interventions to
slightly larger students groups which is typically more effective than providing
one-on-one interventions with a non-certified staff member. As a result,
districts will need fewer certified staff to meet the same instructional needs that
paraprofessionals were serving. Given the shortage of special education teachers
in the state, and particularly in small districts, many of these converted
positions are likely to be filled with general education certified staff. This switch
can be cost neutral.
How is this better for students?
Paraprofessionals play a critical role in supporting students with disabilities.
However, as noted above, overuse of paraprofessional support for academic
support can limit students’ learning and independence, particularly because
paraprofessionals often do not have the certification or training needed to
provide best practice academic interventions to students who struggle
academically.
● Struggling students benefit more from academic intervention delivered
by certified staff with the training and content expertise to accelerate
learning.
● If paraprofessionals focused more on health, safety, and behavior
supports for students, certified staff would take on more academic
intervention for struggling students and students can work more
effectively towards independence.
● Refining the role of the paraprofessional and providing targeted training
enables them to build expertise in health, safety, and behavior strategies,
improving supports for students.
How is this better for staff?

District Management Group | Helping Schools and Students Thrive | www.dmgroupK12.com
70
● Defining and clarifying the role of a paraprofessional helps districts and
schools target trainings and enables paraprofessionals to build expertise
in specific student supports.
● Providing paraprofessionals with a clear role in the classroom and related
professional learning, helps professionalize the role and may increase
retention and satisfaction.
How is this better financially?
● Wyoming has a state-wide overreliance on paraprofessionals to provide
academic support to students. By focusing the role of paraprofessionals
on health, safety, behavior, and severe need supports, districts can reduce
the need for paraprofessionals.
● The savings from fewer paraprofessionals over time should be invested in
more certified staff. This is a cost neutral strategy that yields much better
results for the same dollars spent.
● In the long run, closing the achievement gap through more effective
services will reduce costs as fewer students will need extra help.

District Management Group | Helping Schools and Students Thrive | www.dmgroupK12.com
71
Opportunity #5. Expand the MTSS approach to providing social, emotional, and
behavioral supports for students.
Across the country and the state, there are growing levels of student need for
social, emotional, and behavioral supports. Larger districts across Wyoming had
extensive specialized programs in place for students with severe behavioral
challenges, but many of these districts may not have had an effective district-
wide approach to social-emotional learning and behavior management to
address the more routine needs of many students. Additionally, small districts
struggled with providing supports for students with more intensive needs.
In focus groups and interviews, some districts noted having protocols for
managing crises and handling students with more severe behavioral needs, but
not for behaviors that should be handled in the general education classroom or
through short-term interventions. General education teachers often noted
struggling with handling behaviors within their classrooms and at times
referred to behavior issues as a special education or behavior specialist issue
rather than a classroom issue.
Many districts did have programs like Positive Behavioral Interventions and
Supports (PBIS), but the implementation and impact were inconsistent across
districts and schools.
Best Practice Social-Emotional and Behavioral Systems:
Meeting the social, emotional, and behavioral needs of students requires a
holistic and unified approach. There are many roles that are essential in
supporting the social-emotional and behavior needs of students but creating a
system that ensures students are adequately supported requires coordinating
these roles in a cohesive way.
Research has shown that MTSS models (see Opportunity #2) which incorporate
both academic and social, emotional and behavioral supports produce larger
gains in student outcomes.
16
An MTSS model for behavior is a proactive
approach to supporting students’ social, emotional, and behavioral needs by
equipping classroom staff and students with tools, strategies and interventions.
16
Hanover Research (2014). Best Practices in Multi-Tiered Support Structures.
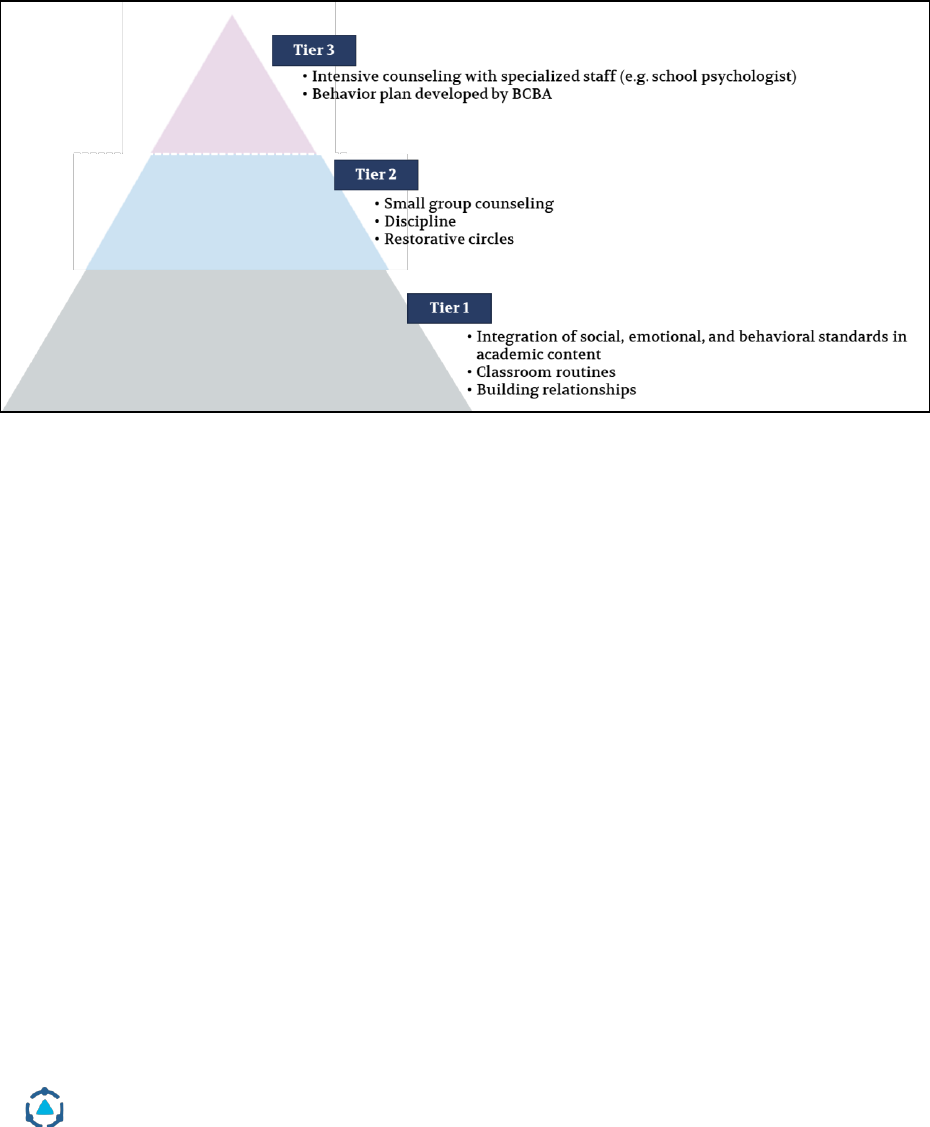
District Management Group | Helping Schools and Students Thrive | www.dmgroupK12.com
72
Like an academic MTSS model (see Opportunity #2 for academic MTSS),
behavioral MTSS models should be tiered. As outlined in Figure 27, a best
practice model includes different strategies for each tier of social, emotional,
and behavioral support. It is important to ensure that the applied support
strategy is matched to the specific tier of the student’s social, emotional, and
behavioral needs.
Figure 27. A best practice tiered approach to behavior support.
Source: DMGroup.
A high-quality system for behavior support starts with effective whole school
and class-wide expectations, routines, positive encouragement, close
relationships, and thoughtful student-centered discipline practices. The general
education teacher plays a central role in executing behavioral supports in the
core classroom by establishing behavioral norms, teaching correct behaviors
through practice, monitoring student progress, and correcting and reinforcing
behavioral expectations.
It is important to first present students with clear and specific examples of
appropriate behavior in order to build a shared understanding of behavioral
expectations. Students should also be provided with opportunities to practice
the appropriate behavior with positive reinforcement, or redirections if needed.
The classroom teacher should model expected behaviors in their classrooms and
often have posters and other notices of expectations and protocols around their
classrooms. Students should be consistently held accountable for their
behaviors. In a classroom that does not have these practices, teachers may have

District Management Group | Helping Schools and Students Thrive | www.dmgroupK12.com
73
inconsistent responses to student behaviors or unspecified or unknown
protocols for classroom routines and procedures.
Classrooms and schools that have these strong Tier 1 practices and protocols
have created a system of prevention based behavioral expectations. This means
that the focus and emphasis of behavioral supports is on preventing negative
student behaviors and in part as a result reduces the need for resource-heavy
Tier 2 and 3 interventions.
In addition to these universal practices, some students with behavioral
challenges will need more support. Detailed data can help identify the triggers
of problematic behavior and skilled experts can advise both students and
teachers how to avoid the triggers, see the indicative warning signs, and develop
coping mechanisms.
Behaviors requiring Tier 3 supports are highly disruptive, often dangerous,
behaviors that significantly impede learning for students both the students
exhibiting the behaviors and their classmates who have their instruction
interrupted by frequent outbursts. It is distracting for students and teachers
alike. Teachers also report that severe student behaviors contribute to their
stress, burnout and leaving the profession.
Students demonstrating these more extreme behaviors typically require
intensive, individualized supports from highly skilled or specialized staff. The
roles that typically have these skills and training include School Psychologists,
Board Certified Behavior Analysts (BCBA), and Behavior Specialists or
Technicians. For these students, an individualized behavior plan may be
required, with intensive supports and goals laid out.
In many districts, social-emotional and special education staff are assigned very
broad roles based on a job title, regardless of their specific strengths, prior
training, or expertise. It is difficult to have expertise in all of the skills asked of a
special educator or school psychologist. It is more likely that staff may have
expertise in one or two of the areas they are asked to do each day.
When possible, staff responsibilities and their use of time should be assigned
based on their strengths and skills rather than their titles. This is paramount for
staff with mental health and behavioral expertise, as they are the most
appropriate staff to support students with more severe social, emotional, and
behavioral needs. Schedules for staff with this expertise and training should be

District Management Group | Helping Schools and Students Thrive | www.dmgroupK12.com
74
optimized to allow them to spend as much time as possible supporting students
on their behavior.
For example, school psychologists are often assigned to a number of different
responsibilities, including coordinating IEPs, conducting evaluations for IEPs
and 504s, providing counseling, and being behavioral experts. However, some
psychologists may be experts in conducting evaluations and coordinating IEPs,
while others may be behavioral and counseling experts. Rather than having all
psychologists performing all of these responsibilities, district should instead
assign responsibilities to psychologists based on their expertise.
Across the nation, there is an increase in the need for, and national shortage of,
school psychologists
17
and an increased demand for Behavior Analysts (BCBAs).
18
The Challenge in Wyoming:
WDE’s guidance on behavioral MTSS was aligned with these best practices.
Included in their guidance was PBIS, an evidence-based tiered approach to
supporting student data. Figure 28 demonstrates PBIS’ guidance for schools and
staff to support students. Tier 1 supports are universal prevention for all
students. Tier 2 supports are targeted prevention, often provided to groups of
students to improve specific skill gaps. Tier 3 supports are intensive,
individualized, prevention focused that are both resource intensive and
developed to support an individual student’s goals based on their unique needs.
17
National Association of School Psychologists (https://www.nasponline.org/research-and-policy/policy-
priorities/critical-policy-issues/shortage-of-school-psychologists)
18
Behavior Analyst Certification Board, US Employment Demand for Behavior Analysts
(https://www.bacb.com/wp-content/uploads/2020/05/US-Employment-Demand-for-Behavior-
Analysts_2019.pdf)
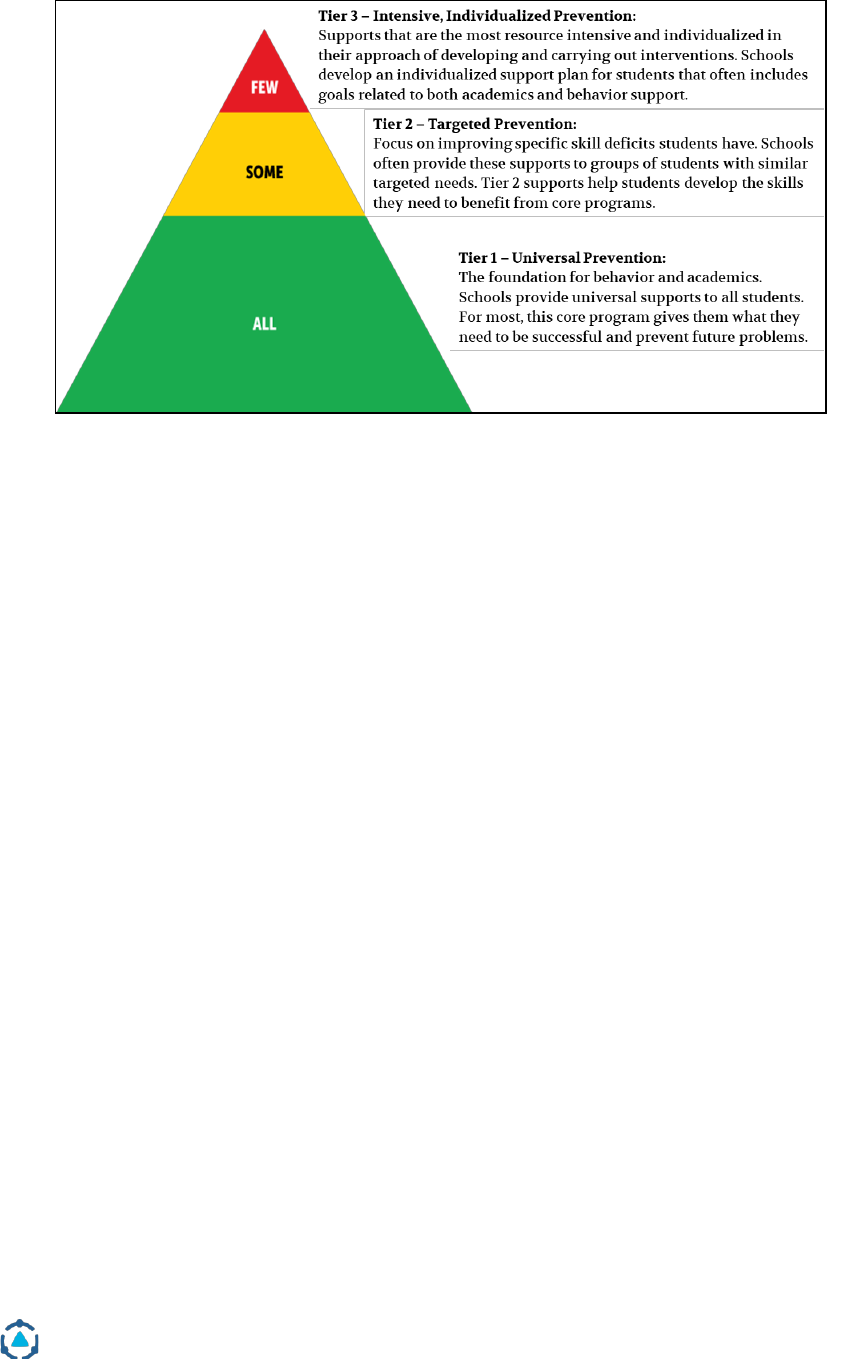
District Management Group | Helping Schools and Students Thrive | www.dmgroupK12.com
75
Figure 28. PBIS guidance for schools and staff to support students at all tiers.
Source: PBIS.
Overall, medium and large districts across Wyoming struggled more with Tier 1
and 2 social, emotional, and behavioral approaches, as they had strong intensive
programs for students with Tier 3 needs. In small districts, the big challenge was
in providing intensive Tier 3 supports, as programs and specialized staff were
harder to source in these districts. Small districts should consider a regional
approach to solving this challenge, as outlined in Opportunity #8.
Most districts DMGroup met with used PBIS or an adaptation of it as their
behavioral MTSS system. However, participants in focus groups across medium
and large districts noted that implementation of PBIS was often inconsistent
between schools and districts. Most teachers did not learn all of the protocols
and procedures for an MTSS behavioral system in school. There is a growing
need for these systems and teachers across the state and country increasingly
overwhelmed by the lack of training and support for classroom behavioral
supports.
Staff and administrators in a few districts noted that this inconsistency or lack
of implementation may be due to insufficient training. One teacher in a focus
group articulated this challenge, “We were supposed to all be trained on PBIS,
but not everyone got the training and so it has not been applied consistently.
Teachers aren’t on the same page across our school.” An administrator in
another district said, “We have MTSS for academic (RTI) and behavior (PBIS), but

District Management Group | Helping Schools and Students Thrive | www.dmgroupK12.com
76
we’re much more haphazard on the PBIS side. Secondary schools don’t even
have PBIS in place.”
In an observation of a large district, DMGroup observers visited multiple
elementary schools. In one school, the PBIS culture was obvious throughout the
hallways and classrooms. This included clear expectations around the school,
incentives for positive behaviors, and consistent protocols in classrooms.
Administrators at this school noted that behavior isn’t a significant issue
throughout the school.
However, in another elementary school within the same district, administrators
and teachers said that student behavior was one of the prevailing challenges for
staff. At this school, while PBIS was in place, many of the key schoolwide
components were unclear or not observed throughout the building.
Additionally, across the medium and large districts DMGroup studied, many
general education teachers said they did not always feel equipped to handle
behavior challenges in their classrooms, which may exacerbate the need for
specialized behavior programs in these districts. In one district, the special
education teachers noted that behavior issues are often viewed as “special
education issues” because classroom teachers did not have the training to
handle these issues in their classrooms. “Behavior issues overshadow academic
issues because teachers don’t have the training and preparation necessary to
handle them,” one administrator said.
In another district, an administrator noted, “All of our teachers are struggling
with classroom management. Everyone wants to know how to help students
with behavior issues, but don’t always know what the next step is so they look to
special education to step in for students with persistent challenges.”
This push from districts to get students into Tier 3 programs and interventions
was eased by the 100% reimbursement model. In most districts outside
Wyoming, schools complain greatly about a shortage of Tier 3 programs. This
was not the case in medium and large districts in Wyoming. The programs
available were great for students across these districts, but a better solution for
some students, as well as the budget, is effective, prevention-focused Tier 1 and 2
interventions and supports.
In schedule sharing, social workers, school counselors, and psychologists in
large and medium districts reported spending most of their time directly
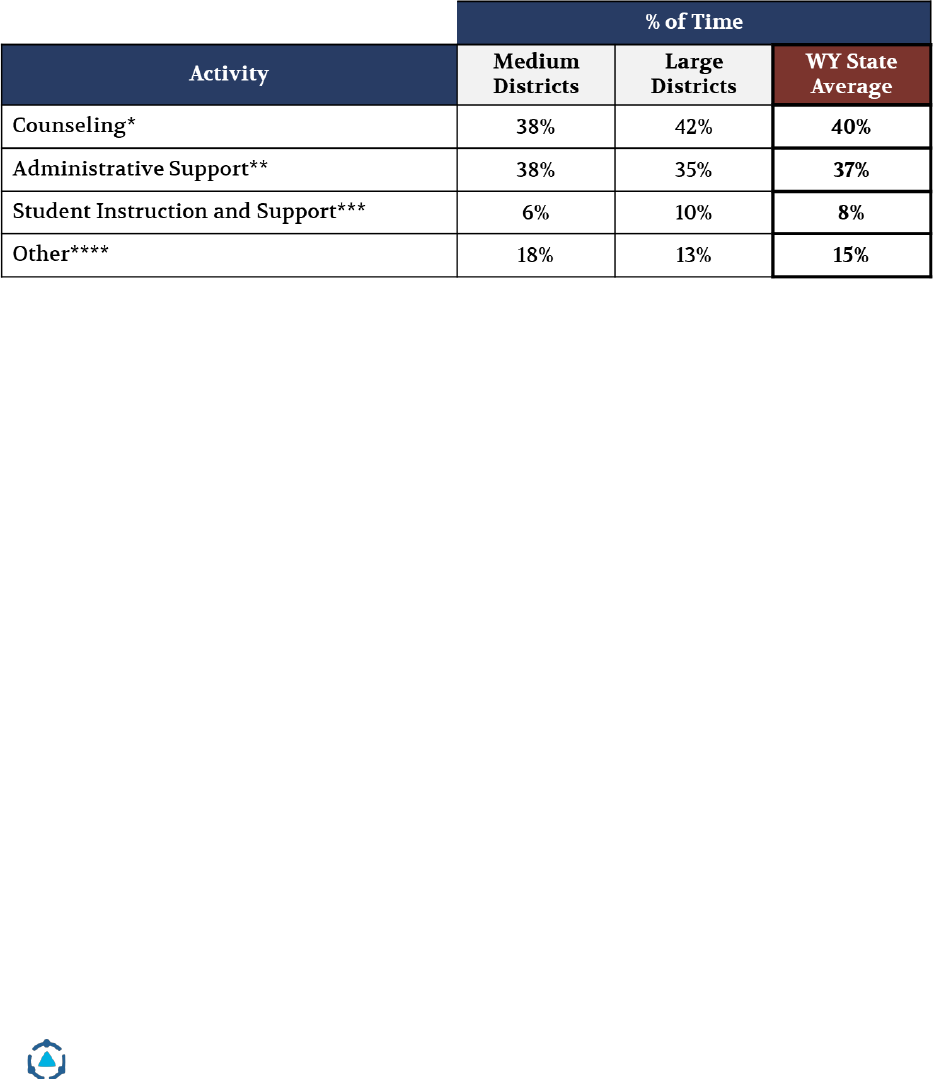
District Management Group | Helping Schools and Students Thrive | www.dmgroupK12.com
77
supporting students. Of their time with students, all of these roles reported
spending only about 10% of their time on student behavior.
Figure 29 shows a breakdown of social worker time in medium and large
districts. Across the state, social workers spent almost half of their time on
counseling and student instruction and support. They spent nearly the same
amount of time on administrative support (37%), such as case management, as
they do on counseling (40%).
Figure 29. Breakdown of social worker time in medium and large districts.
Source: Schedule sharing data. *Counseling includes: 1:1 and small group counseling for students with
and without IEP/504s. **Administrative Support includes: IEP responsibilities (case management, IEP
writing, meetings, testing, and paperwork), planning/materials preparation, collaboration with
colleagues, parent communication, paraprofessional supervision, paperwork (other IEP/504),
professional development, and 504 responsibilities. ***Student Instruction and Support includes:
student instruction and crisis intervention. ****Other includes: Attend meetings (other than IEP/504),
personal lunch, planning/materials preparation, professional development, travel between
schools/transition time, assigned school duties, and over/under reported time.
Figure 30 shows a breakdown of school counselor time in medium and large
districts. School counselors spent a little more than half of their time on
counseling and student instruction and support. However, they spent more time
on administrative support (42%), such as case management, than they do on
counseling (40%).
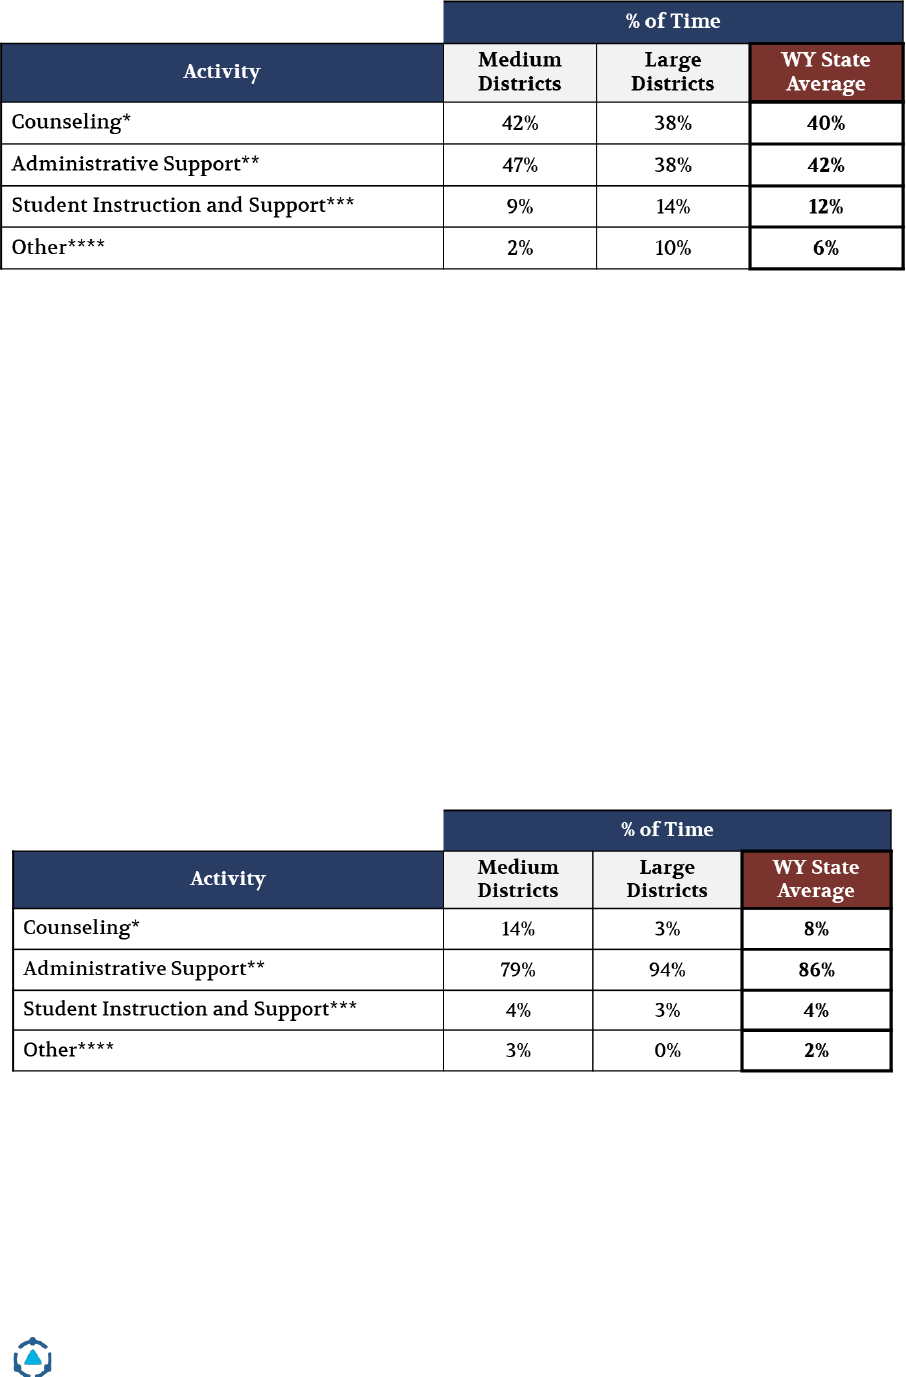
District Management Group | Helping Schools and Students Thrive | www.dmgroupK12.com
78
Figure 30. Breakdown of school counselor time in medium and large districts.
Source: Schedule sharing data. *Counseling includes: 1:1 and small group counseling for students with
and without IEP/504s. **Administrative Support includes: IEP responsibilities (case management, IEP
writing, meetings, testing, and paperwork), planning/materials preparation, collaboration with
colleagues, parent communication, paraprofessional supervision, paperwork (other IEP/504),
professional development, and 504 responsibilities. ***Student Instruction and Support includes:
student instruction and crisis intervention. ****Other includes: Attend meetings (other than IEP/504),
personal lunch, planning/materials preparation, professional development, travel between
schools/transition time, assigned school duties, and over/under reported time.
Figure 31 shows a breakdown of school psychologist time in medium and large
districts. These highly trained and specialized staff spent over 80% of their time
on administrative support, such as IEP responsibilities. While this is typical for
this role, it limits the amount of time psychologists have available to support
students. School psychologists spent on average about 10% of their time
counseling and supporting students.
Figure 31. Breakdown of school psychologist time in medium and large
districts.
Source: Schedule sharing data. *Counseling includes: 1:1 and small group counseling for students with
and without IEP/504s. **Administrative Support includes: IEP responsibilities (case management, IEP
writing, meetings, testing, and paperwork), planning/materials preparation, collaboration with
colleagues, parent communication, paraprofessional supervision, paperwork (other IEP/504),
professional development, and 504 responsibilities. ***Student Instruction and Support includes:
student instruction and crisis intervention. ****Other includes: Attend meetings (other than IEP/504),
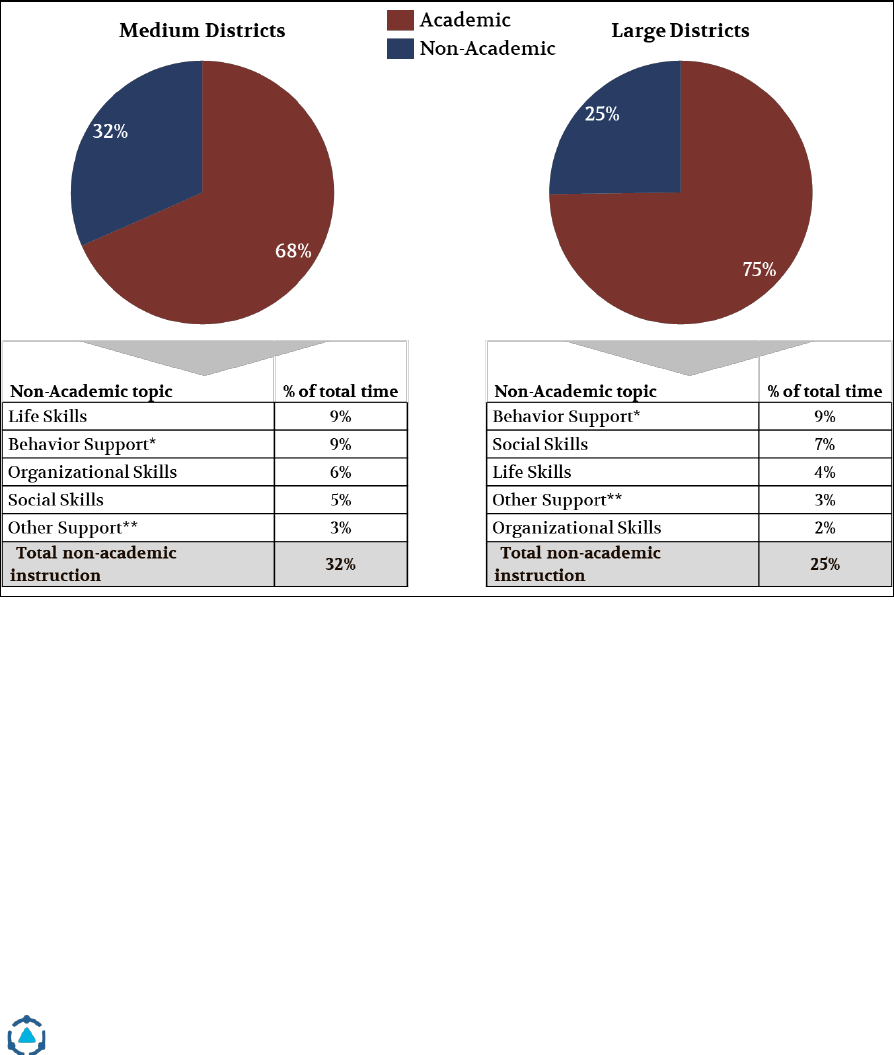
District Management Group | Helping Schools and Students Thrive | www.dmgroupK12.com
79
personal lunch, planning/materials preparation, professional development, travel between
schools/transition time, assigned school duties, and over/under reported time.
As outlined in Figure 32, special education teachers in medium and large
districts also reported about 10% of their time with students on behavior support.
While these staff members did spend a large portion of their time directly
supporting students, unless it is providing classroom and schoolwide supports
to prevent behaviors, they did not provide many Tier 1 supports for students.
Figure 32. Special education teacher time spent on non-academic topics in
medium and large districts.
Source: Schedule sharing data. *Behavior support includes: support in crisis and support that is not due
to crisis. **Other support includes: Specials (Art, Music, PE), personal hygiene, related services, and
physical accommodations.
Because no one role noted spending a large portion of their time on behavior,
this may indicate that the responsibilities for handling student behaviors were
spread across a great many people, with no individual person or specific role
concentrating on the behavior issues.
The EB model provides significant resources for schoolwide social emotional
and behavioral supports, and these should be used to effectively implement

District Management Group | Helping Schools and Students Thrive | www.dmgroupK12.com
80
preventative services to ensure that resource-heavy programming is not
required for as many students. Ultimately, districts will save money on intensive
programs, services, and staff by investing in prevention-based behavior
programs. Students and teachers benefit as well.
How Can Medium and Large Districts in Wyoming Improve their Social,
Emotional, and Behavioral Practices?
While WDE already has systems of supporting students with social, emotional,
and behavioral needs, districts and the state can consider refining their training
and supports around implementation of a tiered system of behavior support or
PBIS. Districts should establish a menu of options for Tier 1 and 2 interventions
to proactively support student behaviors within the general education
classroom. These may include existing strategies that are deployed in schools or
grades with pockets of success or strategies published by WDE and PBIS
themselves. Districts should consider developing a social-emotional learning
curriculum that is integrated into classroom instruction.
With these strategies, districts should work to ensure that all staff, especially all
classroom teachers, are trained in the behavioral systems of support and
understand their role in implementing this system and supporting students
with behavioral needs. The EB and Legislative Funding models have resources
for training and professional development; these funds could be used to train all
staff in PBIS and behavior supports.
Districts may also invest in PBIS and MTSS coaches using resources from the EB
model. Some of these coaches can focus on academics while others should focus
on classroom behavior management. Coaches can provide on-the-job training
and feedback to staff in implementing Tier 1 and 2 behavior interventions and
PBIS systems.
Additionally, for districts to proactively meet the social-emotional and behavior
needs of their students, there has to be an understanding of how all the social-
emotional and behavioral staff will create a cohesive system to meet these
needs. Districts should consider establishing clear roles and responsibilities for
handling student behavioral challenges to align these supports to the systematic
approach to student behaviors, either through PBIS or a similar model. This
requires reviewing the existing roles and setting guidelines for which staff
support what types of needs in their schools. With these aligned roles, training

District Management Group | Helping Schools and Students Thrive | www.dmgroupK12.com
81
should be provided to all staff how they are a part of this larger system of
supports.
How is this better for students?
A systemic approach to social-emotional and behavioral supports for students
ultimately improves student support:
● With a Tier 1 social-emotional curriculum and a menu of options for Tier
2, all students could have better social-emotional development and more
students would have their needs met within the general education
classroom. This should reduce the number of students who are excluded
from core instruction and improve students’ abilities to learn in these
settings, ultimately leading to greater academic success for these
students.
How is this better for staff?
By providing more and better training to staff, as well as clarifying the roles and
responsibilities of different staff members within the larger system of support, the
staff experience should improve:
● Staff would have greater clarity about their role in supporting students
with social-emotional and behavioral challenges, both within and outside
of the classroom.
● Staff would have better training on how to support students with
behavioral challenges. Therefore, staff would be better equipped to handle
behavioral issues when they occurred and proactively prevent them from
happening in their classroom and ultimately teacher burnout could be
reduced.
● Staff could access high quality coaches in behavior and PBIS to better
support students in their classrooms.
Is this more cost effective for districts and the state?
Yes, ultimately a systemic approach to social-emotional and behavioral supports
for students is a more cost-effective approach to supporting students with
behavioral needs. Ultimately, by improving Tier 1 and Tier 2 approaches to
behavior, the need for intensive, costly Tier 3 interventions and programs can be
reduced.

District Management Group | Helping Schools and Students Thrive | www.dmgroupK12.com
82
Opportunity #6. Consider statewide strategies for recruiting, retaining, and
training highly qualified special education staff.
The Challenge with Recruiting in Wyoming:
Administrators and educators from across almost all district, regardless of size,
noted that recruiting and retaining highly qualified special education staff was
one of their biggest challenges. This challenge is not unique to Wyoming, as
across the nation there is a shortage of special education teachers, speech and
language pathologists, school psychologists, and other special education
providers.
19
However, the challenge in Wyoming has been exacerbated by the rural nature of
the state and the limited number of in-state accreditation and teacher training
programs. The United States Department of Education (ED) reported a shortage
of all special education disciplines and grades for the 2018-19, 2019-20, and 2020-
21 school years across Wyoming.
20
In conversations with state and district leaders and practitioners, the roles that
were most discussed as tough to recruit were special education teachers, school
psychologists, speech pathologists, occupational therapists, and physical
therapists.
These challenges have resulted in a few issues for districts. First, many districts
expressed having a high number of exception authorizations for special
education teachers pursuing certification as they work with students. This often
happens when districts are unable to find qualified and certified candidates.
On average, as shown in Figure 33, districts across Wyoming had about six times
as many special educators on certification waivers than general educators.
While few small districts utilize certification waivers for the 2018-19 school year,
some districts had as many as 20% of special education teachers on certification
waivers.
19
National Coalition on Personnel Shortages in Special Education and Related Services.
https://specialedshortages.org/about-the-shortage/
20
US Department of Education Teacher Shortage Area Reports. https://tsa.ed.gov/
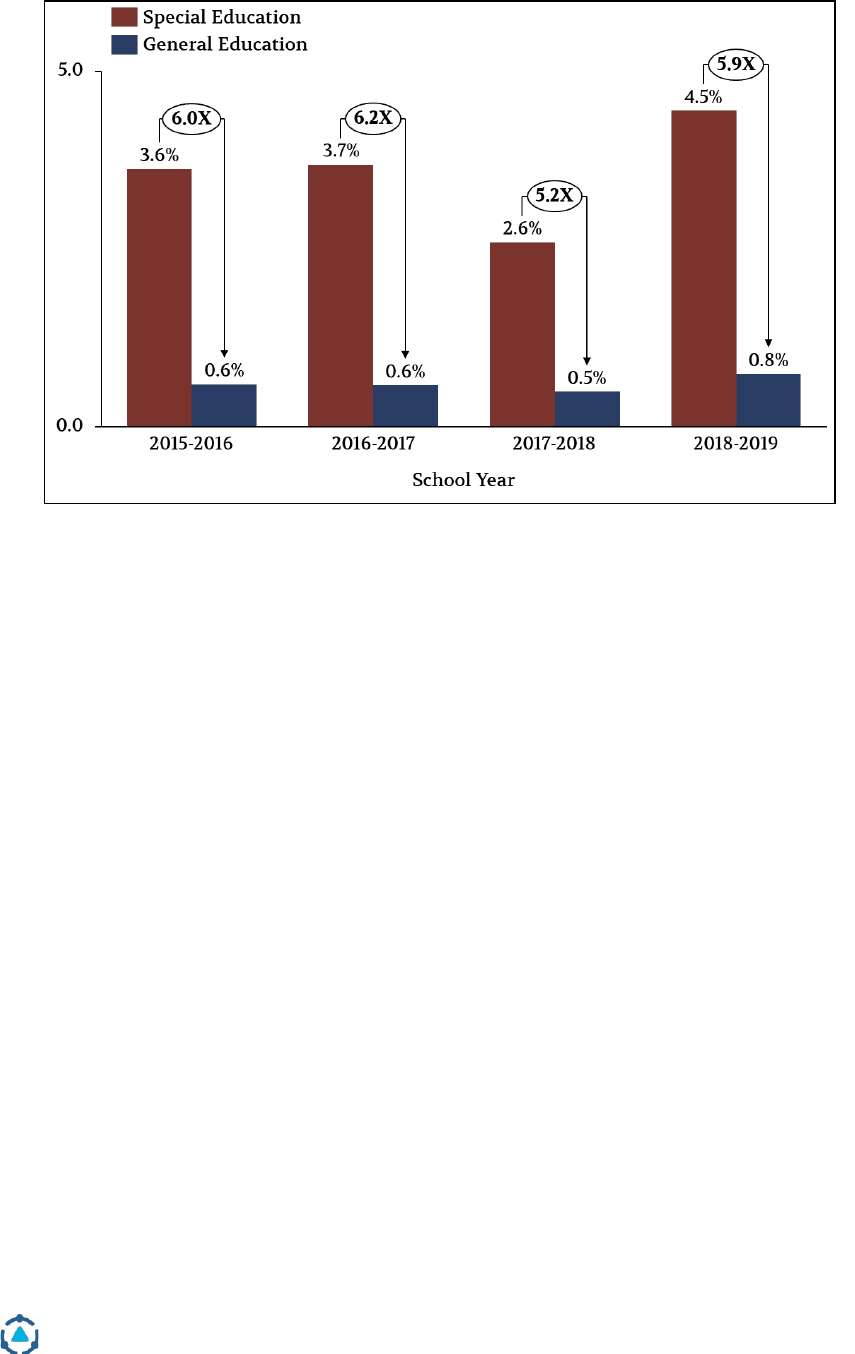
District Management Group | Helping Schools and Students Thrive | www.dmgroupK12.com
83
Figure 33. Percent of teachers on certification waivers.
Source: WDE teacher certification exception data.
Additionally, districts across Wyoming contracted out services from external
providers to fill the voids of positions that were difficult to recruit for or when
there was a need for less than a full-time employee. One hundred percent of
districts that provided data on contracted services reported contracting out for
multiple services for students with disabilities. As shown in Figure 34, most
commonly, districts reported contracting out for physical therapy (81%),
occupational therapy (64%), speech/language services (55%), psychological
services (43%), and counseling (43%). In general, small districts were more likely
to contract out services than medium and large districts.
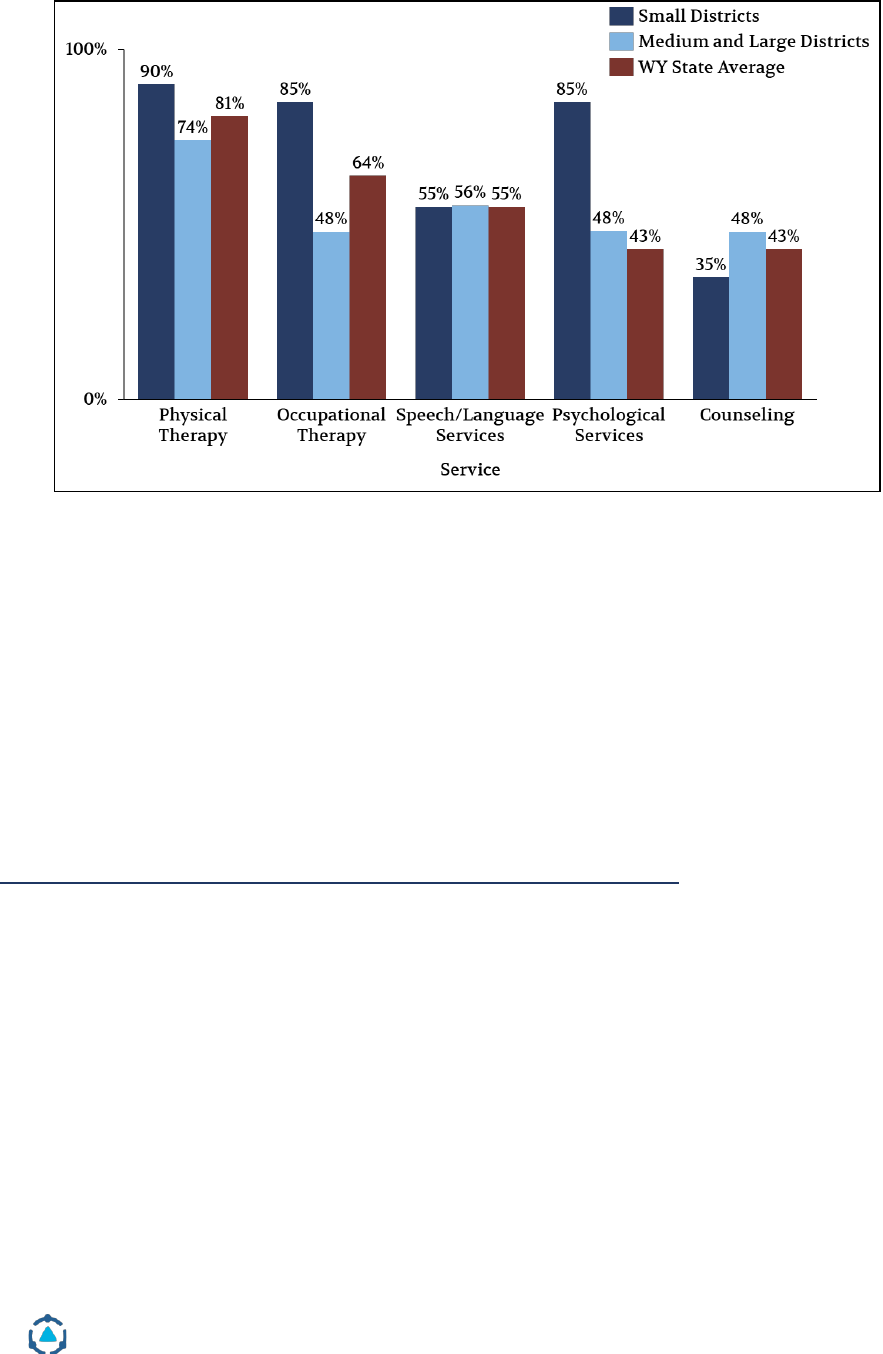
District Management Group | Helping Schools and Students Thrive | www.dmgroupK12.com
84
Figure 34. Percent of Wyoming districts that contract out services.
Source: District provided contracted service data.
While contracting out ensures students receive their needed services, it is often
expensive for districts and does not provide the flexibility for districts to
thoughtfully schedule these services around student core class schedules. These
challenges were raised by many in the districts DMGroup spoke with; one
district administrator said, “[Contracted services] don’t always go smoothly.
We’d like to shift towards more [services from] employees as opposed to
contractors.” A practitioner in another district noted, “I wish the [service
provider] was in the district more than just their contracted days, we’d be able to
better schedule services around student schedules.”
The Challenge of Retaining and Training Special Educators:
Additionally, many districts noted that there is higher burnout in the role of
special education teacher. Special education teachers had many duties on their
plates; in many districts special educators were expected to be experts in student
instruction in multiple content areas and grades, as well as behavioral experts,
IEP compliance specialists, supports for general education staff members, and
parent liaisons. While Wyoming has maintained reasonable caseloads in
attempts to retain staff members, many special education teachers expressed
frustration with the number of responsibilities on their plates, and attribute this
to the higher turnover in this role.

District Management Group | Helping Schools and Students Thrive | www.dmgroupK12.com
85
One special education teacher said, “I would like to have more defined roles as a
special education teacher... I wear two hats, classroom teacher and case manager.
However, there is no time built in our days to do the case manager parts, this is
all done on top of the PLC’s and classroom [teacher] responsibilities.”
This frustration with the role is so strong in many places that special education
teachers often tried to move to general education positions when they opened
up. However, in one large district, special education teachers expressed that this
is nearly impossible, “I feel like I’m stuck, I’ve been trying to move into a general
education role for a few years. But we have unfilled special education positions,
so I’m forced to stay here... It’s causing burnout for those of us in the role.”
These challenges have led to higher turnover rates in special education teachers.
Nationally, special education teachers have a 46% higher predicted turnover rate
than elementary school teachers.
21
Although Wyoming does not report data on
teacher attrition, anecdotally, state and district administrators across the state
noted a higher turnover in special education staff than general education staff.
High turnover in special education roles has added challenges to building a
consistent knowledge base and application of practices, including MTSS, co-
teaching, behavioral supports, or the special education identification and
referral process. This has held true in one district where an administrator said,
“MTSS has been challenging for us because it’s hard to build the knowledge base
over time when there is a lot of teacher turnover,” and a practitioner noted, “The
turnover of special education teachers has made it hard to work as a cohesive
team.”
In another district, teachers and administrators expressed how special
education teacher burnout and turnover has created challenges with effectively
implementing co-teaching, as that practice requires relationship building
between teachers and extensive training that they cannot offer every year.
Further, focus group and interview participants shared that the ongoing
training of special education staff is at times limited and that the preparation
programs in the state are often insufficient. This may be in part due to the shift
in University of Wyoming’s program for special education certification. This
challenge only exacerbated these issues of recruiting and retaining highly
qualified special education staff.
21
Learning Policy Institute. Teacher Turnover: Why It Matters and What We Can Do About It (2017).

District Management Group | Helping Schools and Students Thrive | www.dmgroupK12.com
86
The Acute Challenge in Small Districts:
While recruiting and hiring special education staff is challenging across
Wyoming, this challenge was acutely felt in small, rural districts across the state.
In these districts, finding staff members to fit specialized roles has been made
more difficult by the lack of proximity to cities and universities that produce
and train them.
In general, small districts had to contract out for more services than larger
districts (see Figure 34) and had up to 20% of special education teachers on
certification waivers in some districts. In one district, there was a vacancy for a
Speech Pathologist for over two years before they got a qualified candidate. This
meant that the district had to pay for contracted services despite having the
need for a full-time person in the position. The added challenge for this rural
community came when the district (and thus the state through the
reimbursement program) had to pay not only for the time in service with
students but also for the travel time to these rural communities, many of which
are hours from the nearest city.
In many small districts, this challenge caused many practitioners to wear many
different hats to fill the needs that existed in their schools. This could include a
district administrator also acting as a school-based practitioner or a special
education teacher who is shared across multiple buildings, grades, and subject
areas. This makes doing any one role well especially challenging for folks in
these positions. In one district DMGroup spoke with, a single special education
teacher “worked with 6 different grades and multiple content areas. It’s hard to
do that well.”
What Could Wyoming Do Differently to Help with These Challenges?
There are several strategies Wyoming can launch to improve the recruitment,
retention, and training of highly qualified special education staff.
Change funding and certification requirements
First, Wyoming could change the funding and certification requirements so that
general education staff could more easily deliver instruction for students with
disabilities. Expanding the role of general education staff to deliver primary and
intervention instruction to students with mild and moderate disabilities reduces
the need for special education teachers across the state and helps mitigate the
need for certification waivers for special education staff. More information on
this can be found in the funding review section.

District Management Group | Helping Schools and Students Thrive | www.dmgroupK12.com
87
Expand guidance on grow your own programs
WDE could provide more guidance and support on how to “grow your own”
programs to identify high quality paraprofessionals, general education teachers,
and/or high school students to become special education staff in hard-to-recruit
positions. Already, many districts utilized grow your own programs and
pathways with success. In these programs, districts pay for the schooling of staff
members (e.g. paraprofessional, general education teacher) in exchange for a
commitment of staying in the district for three years. Typically, a district
identifies staff members who have potential to be successful in a future role and
provide the resources for that staff member to get the necessary training and
certification. In one district, this process was used to grow paraprofessionals
into certified teachers, including certified special education teachers. In another
district, this process was used to grow a speech and language pathologist, a
position that was nearly impossible to recruit for in that community.
Districts should continue using thoughtful strategies, including reviewing
student data, reviewing staff evaluations, and questioning during interviews, to
identify staff with high potential for success in special education and specialized
roles and provide opportunities for the growth and development of those staff
members. WDE can provide more resources and supports for districts in
establishing these grow your own programs and guidance for ensuring these
programs are successful and effective.
Differentiate pay for special educators
Additionally, the state can support districts in differentiating the pay for special
education teachers, related service providers (psychologists, speech/language
pathologists, occupational therapists, and physical therapists), and other hard to
fill positions. In some districts, related service providers were in a different
bargaining unit than certified teachers, making their pay more competitive with
surrounding communities, a strategy that has worked with some success. If the
state supports districts in differentiating the pay for more positions, the special
education roles may be more desirable, creating incentives for staff to become
special education certified.
Consider regional approaches to recruiting and hiring
Districts and the state could consider using regional approaches to recruiting
and hiring staff members in hard to fill roles. Using regional non-profit
organizations and other external parties, the recruiting and hiring process can
be moved from districts to a new entity. These organizations can use

District Management Group | Helping Schools and Students Thrive | www.dmgroupK12.com
88
compensation strategies that will grow the pool of candidates, such as higher
base pay and less costly benefits.
In smaller and more rural communities, using these regional approaches,
including pooling resources together to hire full-time staff, can help with tough-
to-fill positions and positions where there isn’t a need for a full-time employee.
For example, if two districts in the southwest region of Wyoming need part time
speech pathologists, they can hire one person and split their time across the
districts. Full time positions are usually easier to fill than part time positions.
Collaborative organizations, including a Board of Cooperative Education
Services (BOCES), could help by hiring a pool of qualified professionals in
specific hard-to-find positions for these smaller and more rural communities.
According to Wyoming statute, the purpose of BOCES includes “provide a
method whereby school districts and community college districts or any
combination may work together and cooperate to provide educational services,
including… services for children with disabilities, when the services can be
more effectively provided through a cooperative effort.”
22
BOCES could be
utilized to help recruit and hire staff in specialized roles that can be shared
across multiple districts. Some BOCES already do this with psychologists and
other related service roles, but their role in recruiting and hiring these staff
members could be expanded to support more school districts.
Expand recruiting strategies outside of the state
Additionally, districts across Wyoming can expand their recruiting strategies
outside of Wyoming. By recruiting from the surrounding states, especially at the
state’s flagship universities, Wyoming can expand their pool of special
education staff members and can recruit staff who have a variety of different
educational backgrounds. This approach lends itself to regional efforts to share
the cost of out of state recruiting and interviewing.
Align University of Wyoming’s teacher preparation to state needs
Finally, WDE and the Wyoming Legislature can ensure that there is alignment
between the University of Wyoming’s teacher preparation programs and the
needs of schools and districts around the state. As noted earlier, many
practitioners and administrators felt that University of Wyoming’s program was
not fully preparing staff for the demands in their schools and districts. The state
22
Wyoming Statute 21-20-102

District Management Group | Helping Schools and Students Thrive | www.dmgroupK12.com
89
can review and re-align the program to train staff for the roles they will take on
in schools.
How is this better for students?
The challenge of recruiting, retaining, and training special education staff
members is critical for the success of students.
● By establishing and expanding strategies to recruit special education
staff, students will have access to more services from certified and trained
staff members.
● By creating better systems to retain and train special education staff,
students will have access to experienced staff with specialized expertise in
the areas of support, ultimately improving services for students.
How is this better for staff?
Special education staff are experiencing burnout and high turnover in special
education positions. Through these strategies for recruiting and retaining staff,
staff have access to better pay, more training, and opportunities for growth.
Is this more cost effective for districts and the state?
There are a few ways that taking these approaches is more cost-effective for
districts and the state:
● Through taking regional approaches to recruiting and hiring specialized
special education staff, districts can save money on contracted services.
Instead of paying the premium for a part time contracted speech
pathologist, districts can split the cost of a full-time employee with a
neighboring district. Alternatively, by utilizing regional collaboratives,
districts can pay a less-expensive fee for their contracted service and
invest less time and money in recruiting for these positions.
● Though grow your own pathways are at times costly for schools and
districts, ultimately, they are no more expensive than the investment in
recruiting and competing for a limited number of staff in roles that are
hard to recruit and hire for.
● Expanding the reach of general educators in supporting students with
disabilities is ultimately more cost-effective. It both reduces the cost of
recruiting staff and reduces the need for specialized positions.
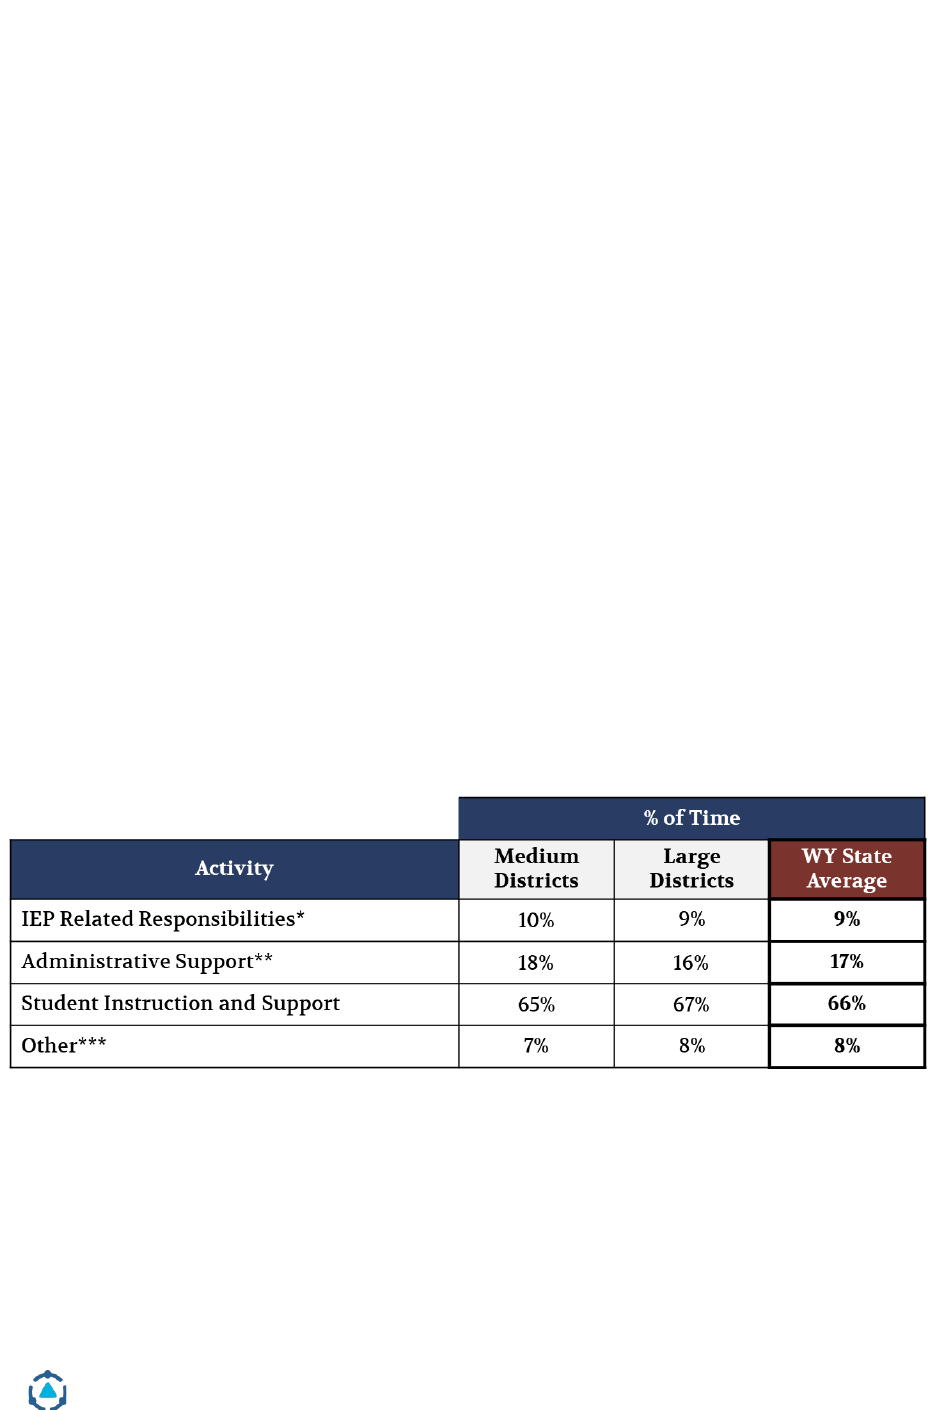
District Management Group | Helping Schools and Students Thrive | www.dmgroupK12.com
90
Opportunity #7. Reduce the administrative duties (e.g. paperwork, meetings)
for special education teachers through process mapping, utilizing the case
management model, and allowing them to play to their strengths.
In focus groups, interviews, and schedule sharing, special education teachers in
many districts across Wyoming noted one of the most challenging aspects of
their role is the paperwork and administrative duties on their plates. Special
education teachers were often held responsible not only for providing direct
service to students, but also for managing IEPs, designing differentiating
lessons and curricula, collaborating with general education teachers, liaising
with parents, and coordinating student supports.
In all districts across the state, special education teachers reported spending
almost 30% of their time on paperwork and administrative duties (see Figure 35).
Paperwork and administrative duties include IEP responsibilities, materials
preparation, collaboration with colleagues, attending meetings, parent
communication, paraprofessional supervision, paperwork, professional
development, and 504 responsibilities. This percent was consistent among
districts of medium and large sizes. Considering the total cost of special
education teachers across the state was about $91,000,000, the total cost of time
on paperwork and administrative duties was about $27,000,000.
Figure 35. Breakdown of special education teacher time across medium and
large districts in Wyoming.
Source: Schedule sharing data. *IEP Related Responsibilities includes: Case management, IEP writing,
meetings, testing, and paperwork. **Administrative Support includes: planning/materials preparation,
collaboration with colleagues, parent communication, paraprofessional supervision, paperwork (other
IEP/504), professional development, and 504 responsibilities. ***Other includes: Attend meetings (other
than IEP/504), personal lunch, planning/materials preparation, professional development, travel
between schools/transition time, assigned school duties, and over/under reported time.

District Management Group | Helping Schools and Students Thrive | www.dmgroupK12.com
91
Special education teachers in focus groups and interviews attributed staff
burnout and turnover in special education teachers to the many responsibilities
on their plate.
Best Practice: How Have Other Districts Handled This Challenge?
Specialized Special Education Teachers & Case Management Model
The challenges of juggling the many responsibilities of being a special
education teacher is not unique to districts in Wyoming. Across the country,
there are higher turnover rates of special education teachers
23
and research cites
role conflict, role ambiguity, and administrative duties as some of the largest
factors why special educators leave the field.
24
One way that districts across the country have addressed this challenge is by
allowing teachers to identify their areas of strength and interests. Districts can
then move towards specializing the deployment of special education teachers to
their desired content area or responsibility. In general, there are four ways a
special education teacher’s role may be specialized: content-specific expertise,
pedagogical expertise for struggling students, social-emotional expertise, and
case management expertise.
1. Content-specific expertise: Primarily responsible for delivering
instruction in their area of expertise, making use of best-practice
instructional strategies to help students reach grade-level mastery.
2. Pedagogical expertise: Support to general education teachers in helping
to accommodate the needs of students with disabilities, ensuring that
teachers use scaffolding, differentiation, chunking, and other strategies to
meet students’ needs.
3. Social-emotional expertise: Work with students on self-monitoring
strategies to bring behavioral or emotional challenges under control, rather
than simply managing outbursts.
4. Case management expertise: Focus solely on case management
responsibilities in order to free up time for other special education teachers
to maximize the amount of time they are serving students.
23
Learning Policy Institute. Teacher Turnover: Why It Matters and What We Can Do About It (2017).
24
Brunsting, Sreckovic, & Lane (2014). Special Education Teacher Burnout: A Synthesis of Research from
1979 to 2013.
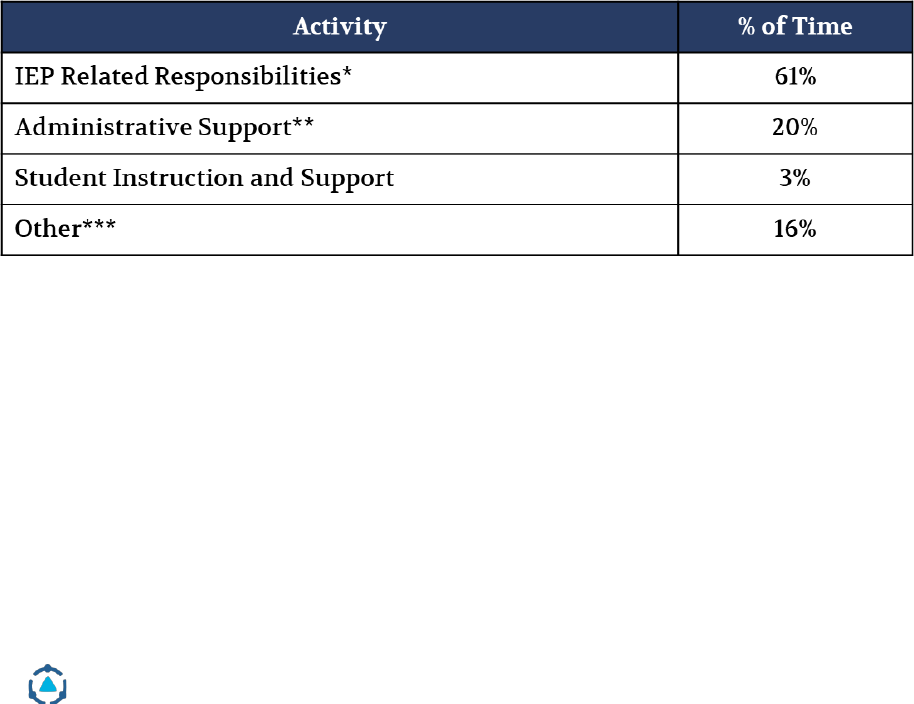
District Management Group | Helping Schools and Students Thrive | www.dmgroupK12.com
92
Using a model that allows special education teachers to focus on one or two of
these distinct roles allows for special education teachers to play to their
strengths and to enhance the effectiveness of each role. This strategy allows for
a better delineation of roles and responsibilities. As a result, special education
staff would spend more time working directly with students, provide better and
more individualized services to students, and create higher quality and more
compliant IEPs. Further, allowing special education teachers to specialize and
play to their strengths creates better services for students and streamlines their
responsibilities.
In medium and large districts across Wyoming, some districts already utilized a
case management model, in which special education teachers and case
managers functioned in separate roles. Case managers generally handled more
of the management, coordination, and compliance of IEPs and were meant to
free up time for other special education teachers to work directly with students.
In medium and large districts, case managers who participated in schedule
sharing reported spending about 60% of their time on IEP related
responsibilities and 20% of their time collaborating with colleagues or
communicating with parents (see Figure 36).
Figure 36. Breakdown of case manager time.
Source: Schedule sharing data. *IEP Related Responsibilities includes: Case management, IEP writing,
meetings, testing, and paperwork. **Administrative Support includes: Collaboration with colleagues
and parent communication. **Other includes: Attend meetings (other than IEP/504), personal lunch,
planning/materials preparation, professional development, travel between schools/transition time,
assigned school duties, and over/under reported time.
Districts that did use this model noted in focus groups and interviews many of
the benefits of this model. One special education teacher articulated the benefits
of this model for her district, “In [my previous district], we spent about half of
our time setting up meetings and managing IEPs. Here, when you have a high-
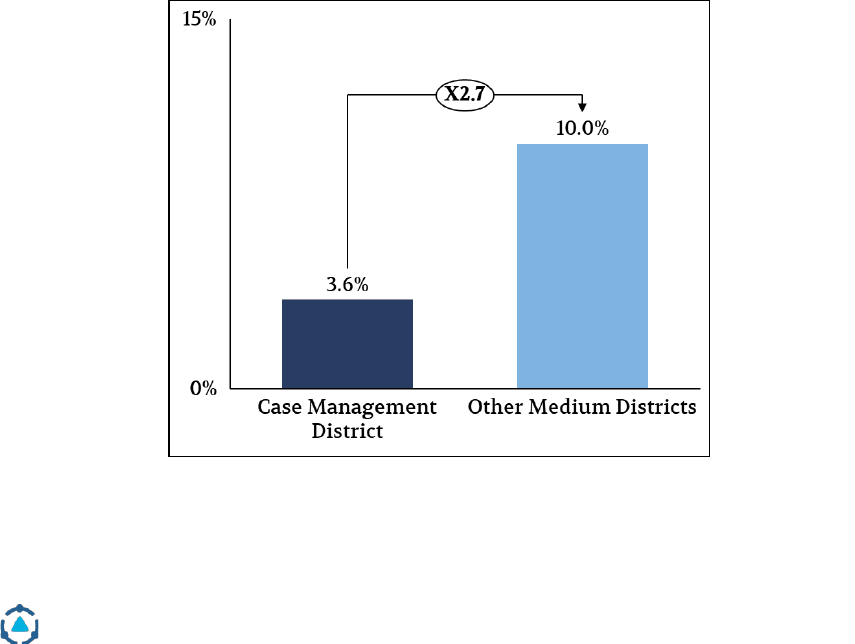
District Management Group | Helping Schools and Students Thrive | www.dmgroupK12.com
93
quality case manager running the nuts and bolts of the IEP process and that
makes your life so much better.” Another teacher in this same district said, “Case
managers can check IEPs and documentation to ensure we’re following the law.
[They’re role] helps tremendously in meeting kid’s needs.”
Staff in medium and large districts that did not use case managers generally
expressed a desire to switch to this model. One special education teacher in one
of these districts said, “I am responsible for being a case manager, a special
education teacher, and a curriculum modifier. My role would be much better if
we could separate the case management out.” In another district, a teacher wrote
in feedback on schedule sharing, “I’d like to find a way to have less paperwork
required for IEPs, testing and liability. This would allow more time to work with
students.”
This was reflected in schedule sharing as well. Special education teachers in one
medium size district with a case management model spent about a third of the
time on IEP related responsibilities than their peers in other medium sized
districts (see Figure 37). This additional time spent on IEP responsibilities can
often take away time that these teachers would have spent supporting their
students and preparing materials.
Figure 37. Comparison of the percent of special education teacher time on IEP
related responsibilities in a case management district and other districts.
Source: Schedule sharing data.
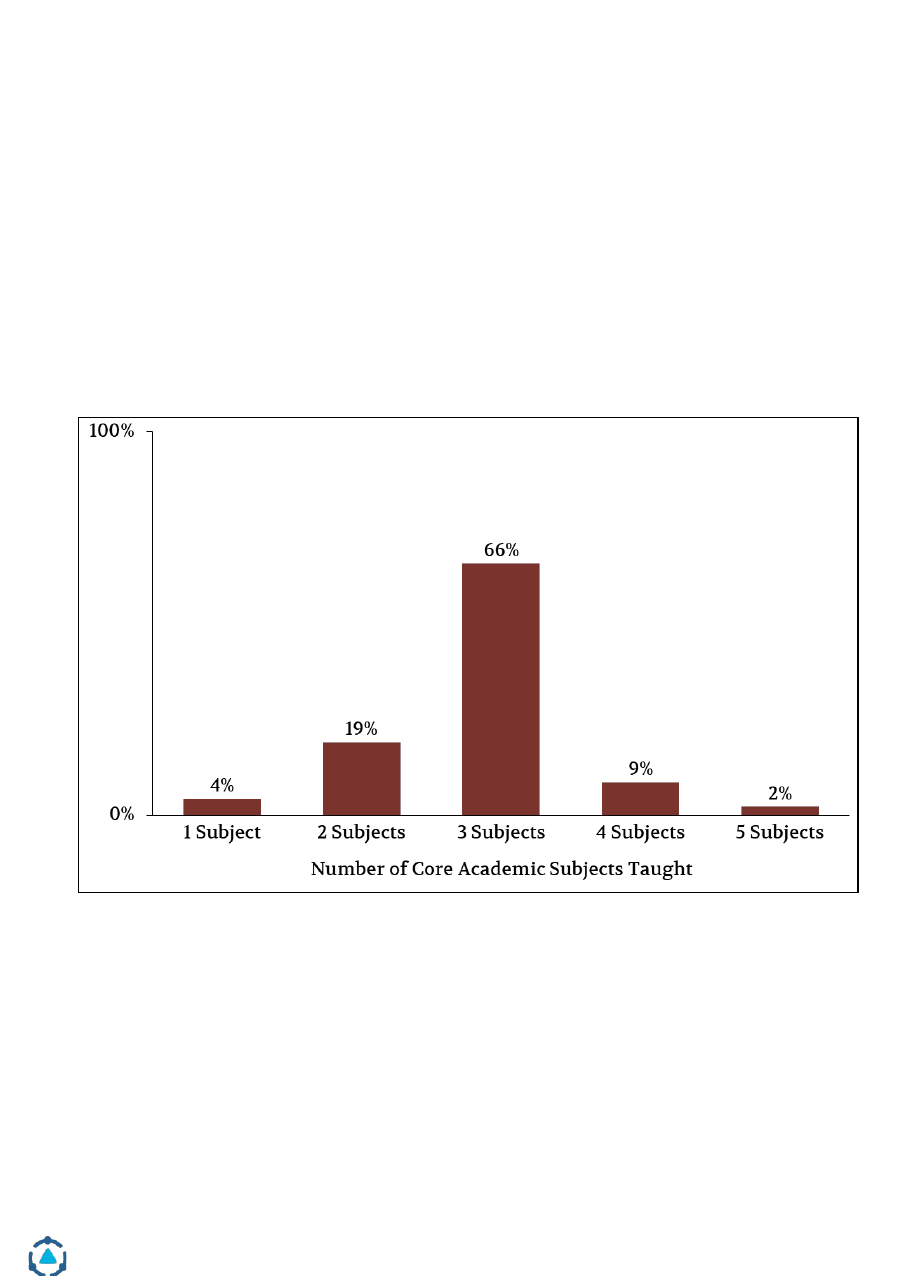
District Management Group | Helping Schools and Students Thrive | www.dmgroupK12.com
94
Additionally, many districts across Wyoming did not specialize special
education teachers by content area. As a result, most special education teachers
provided instruction in multiple subject areas, adding to their workloads and
responsibilities, and potentially limiting the impact they can have on students.
Data from schedule sharing indicated that a majority of special education
teachers (62%) taught three or more core subjects (reading, writing, math, social
studies, science). This was more pronounced at the elementary level (see Figure
38) than at the secondary level (see Figure 39) but was true for a majority of
teachers at both levels. Teaching multiple subjects can add to the amount of
preparation and planning required, while also reducing the likelihood that the
teacher will have content expertise in all the subjects they teach and thus less
effectiveness with students. Having content expertise becomes even more
essential given that content becomes more complex at the secondary level.
Figure 38. Percent of elementary special education teacher teaching multiple
core academic subjects.
Source: Schedule sharing data.
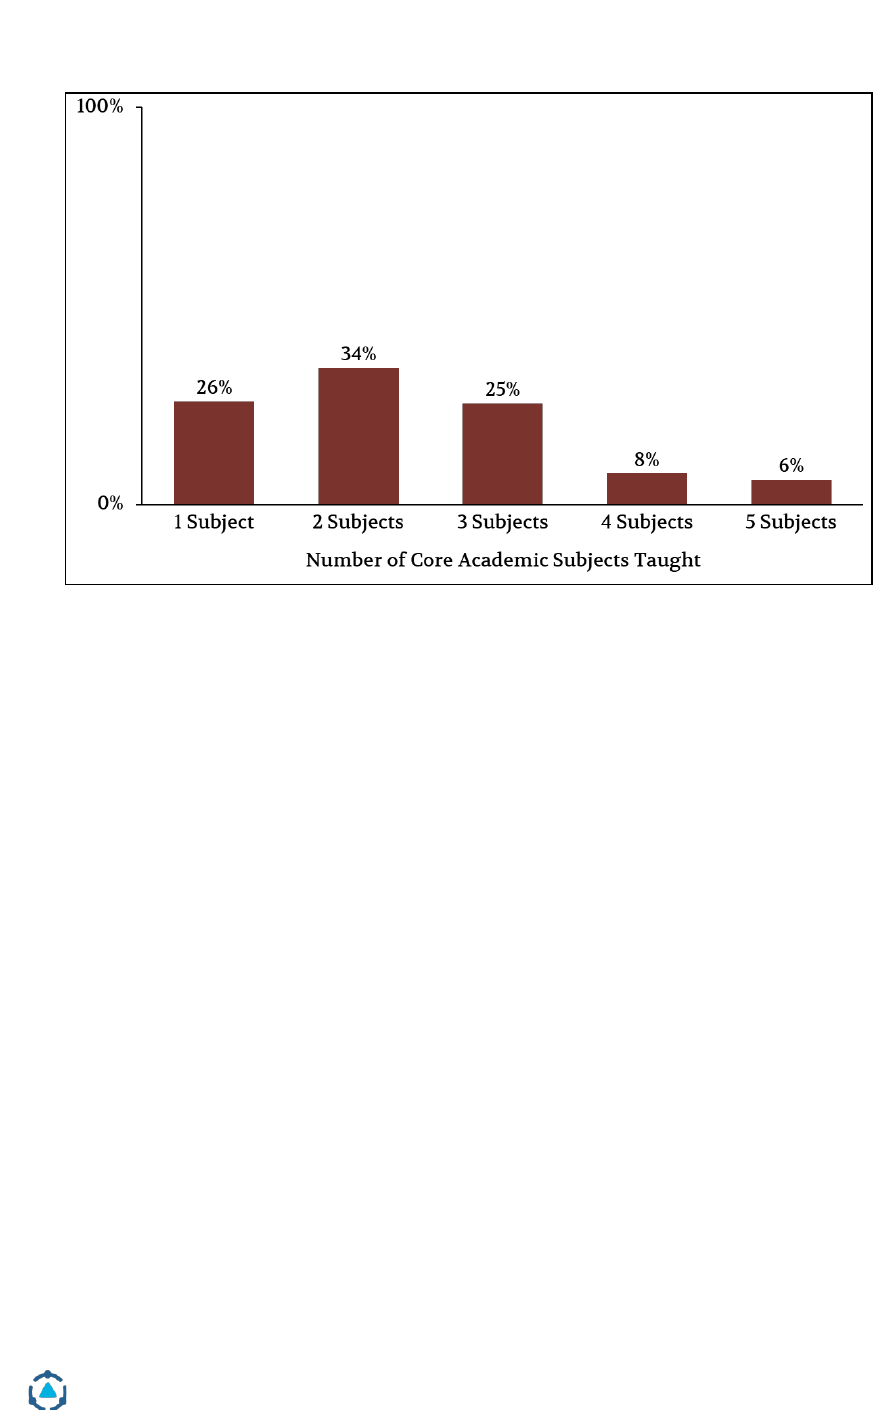
District Management Group | Helping Schools and Students Thrive | www.dmgroupK12.com
95
Figure 39. Percent of secondary special education teacher teaching multiple
core academic subjects.
Source: Schedule sharing data.
By deploying special education teachers based on content expertise, staff can
“play to their strengths” and reduce their paperwork and preparatory duties.
This practice is also better for student instruction.
Process Mapping to Reduce Administrative Duties
Another solution schools and districts can take to reduce the administrative
duties of special education teachers, even without a case management model, is
called process mapping. This includes thoughtful guidance on how staff use
their time and streamlining the paperwork and meeting portion of their work.
Districts can increase staff time with students by taking a deeper look at the
most time-consuming aspects of their role. Process mapping involves listing the
steps of a large task (e.g. Annual IEP Meetings), detailing the most time-
consuming elements, and listing who is involved in each step and how it is done.
Then, districts should question each step to answer some key questions:
1. Who is in the room: Are there meetings some staff members do not need
to attend, can attend occasionally, or can attend only for part?

District Management Group | Helping Schools and Students Thrive | www.dmgroupK12.com
96
2. Process efficiency: Are there steps in the process that can be eliminated,
streamlined, or occasionally skipped? Are there steps that certain staff
members are better at?
3. Dispel myths: What myths or historical practices are guiding parts of this
process?
Through this process, districts can update, adjust, and streamline processes for
special education teachers to reduce their administrative duties. Additionally, in
many districts, this process helps offload administrative tasks like scheduling
meetings and logistics to clerical or noncertified staff members. Some districts
have reduced paperwork and meetings by 20% or more through process
mapping. A 20% reduction in meetings and paperwork would free up about 6% of
special education teacher time, or about $5,000,000 of teacher time.
Across Wyoming, these aspects of the role were consistently noted as one of the
biggest challenges for special education teachers. One teacher wrote in schedule
sharing, “[I struggle] to keep up with the drowning amount of never-ending
required paperwork” when asked what they would change about their role to
better support students.
During a focus group, a principal in one district noted, “[special education
teachers experience] death by paperwork. They are doing the best they can but
there is too much paperwork that goes with the role. It’s become a hurdle and an
obstacle for what’s best for kids.”
How Could Wyoming Districts Apply These Practices?
Across Wyoming, districts can apply both of these practices to reduce the
administrative and paperwork duties of special education teachers. When
possible, districts can utilize a case management model in which most special
education teachers focus on providing services for students while other teachers
are case managers, responsible for IEP coordination, writing, and compliance.
Additionally, districts can specialize the responsibilities of staff members
providing services to students based on their specific instructional expertise.
This will allow districts to have staff “play to their strengths,” based on content
area, pedagogical expertise, and social emotional supports. By doing this, staff
members can streamline their responsibilities and can help with the
recruitment and retention of staff. This is especially realistic in medium and

District Management Group | Helping Schools and Students Thrive | www.dmgroupK12.com
97
large districts across the state, where there are multiple special education
teachers at each level who can specialize by content area and case management.
These districts can apply the case management model and specialize their
special education teachers often using their existing staff. Administrators
should use staff preference and data to determine which staff should specialize
in specific content areas, pedagogical expertise, and case management. In
general, this model is cost-neutral for districts, as it shifts responsibilities
around, but does not add or remove responsibilities of staff members.
Districts can also work with practitioners to process map and streamline the
responsibilities of special education teachers and other staff, as necessary. By
doing this, staff members can find ways of streamlining paperwork and
minimizing participants in meetings and can free up more time for student
support and eventually reduce the number of special education teachers needed.
How is this better for students?
Reducing the administrative duties of special education teachers and
specializing their roles is better for students in several ways:
● Staff are able to devote more and better support for students, by
increasing their time devoted to student support and specializing in an
area in which they are a true expert.
● The quality and compliance of IEPs can increase, becoming more
responsive to the specific needs of a student.
● Staff are more likely to stay in the role as a special education teacher. By
decreasing the turnover rate in the role, students can access higher quality
instruction from more experienced teachers.
How is this better for staff?
Special education teachers across the state expressed frustration with the
paperwork and administrative duties associated with their role. Through these
processes, staff can devote more time to students and reduce these
responsibilities without sacrificing high quality instruction and support.
Ultimately, this should reduce the turnover in special education teachers and
improve satisfaction in the role.

District Management Group | Helping Schools and Students Thrive | www.dmgroupK12.com
98
Is this more cost effective for districts and the state?
Utilizing a case management model with specialized special education staff
ultimately should not cost more for districts and the state. Ultimately, the same
number of staff should be required in these models, just the responsibilities of
these staff members is shifted.
By streamlining the paperwork and administrative duties of special education
teachers, fewer special educators would be needed to provide the same level of
student services, as staff will have more time available to work with students.
Streamlining is easier with the case manager model.

District Management Group | Helping Schools and Students Thrive | www.dmgroupK12.com
99
Opportunity #8: Take a regional approach in small districts to improve services
for students with more severe needs and to providing intensive behavioral
supports.
Across Wyoming smaller and more rural school districts face heightened
challenges supporting students with more severe special education needs, as
serving these students requires unique, individualized programs. Many of the
smaller districts did not have, or only had limited, severe needs programs within
their district. This includes supports for students with intensive life skills,
severe autism or significant behavioral needs. While out of district placements
were not high in these districts, smaller districts can consider ways of better
supporting these students through regional approaches to ensure their needs
are met at a potentially lower cost and higher quality.
There are two different regional approaches that can help:
1. Regional specialized programs
2. Regional teams to support students with intensive behaviors
High Quality Specialized Programs:
High quality specialized programming for students with severe needs should
include a few key components: highly specialized and trained staff, students
grouped with similar needs and developmental similarities, and when
appropriate, access to inclusion in some general education settings. For a
program to be cost effective, there should be at least 3-4 students with similar
needs and disabilities and in a similar age range. In smaller districts, creating
programs that were high quality and cost effective were very challenging
because often just one or two students should be grouped together.
In many larger districts, students with more severe needs were often served in
specialized programs, including life skills programs, behavior programs, or
transition programs (defined below).
• Life skills programs: Functional or intensive life skills programs are
specialized programs that focus on developing student independence and
functional academic skills. This includes self-care, vocational academic
skills, and self-advocacy. These programs are often for students with
significant intellectual disabilities.

District Management Group | Helping Schools and Students Thrive | www.dmgroupK12.com
100
• Behavior programs: Behavior programs are specialized programs that
support students behavioral and social-emotional development, in
addition to their academic skills. These programs are often for students
with intensive behavior and social skills needs.
• Transition programs: Transition programs are specialized programs for
students transitioning out of a school district. They are typically for
students who are 18-22 and put an emphasis on vocational and
independent living skills. These programs support students in moving
from high school into adult life.
The Challenge with Specialized Programs in Small Districts:
In smaller districts, many of these programs only existed when the need arises.
While this is a good thing, this means that districts were often tasked with
establishing a program from scratch quickly when a student moves into the
district with a need. These programs were often smaller and less robust than in
the larger districts and were resource intensive, often requiring additional staff,
materials, and programming.
As shown in Figure 40, on average, special education teachers in small districts
spent about 15% of their time with students in self-contained settings. This was
less than the state average and less than medium and large districts. This
indicates that while self-contained settings were used in smaller districts, they
were used less frequently and with a smaller number of teachers than larger
districts.
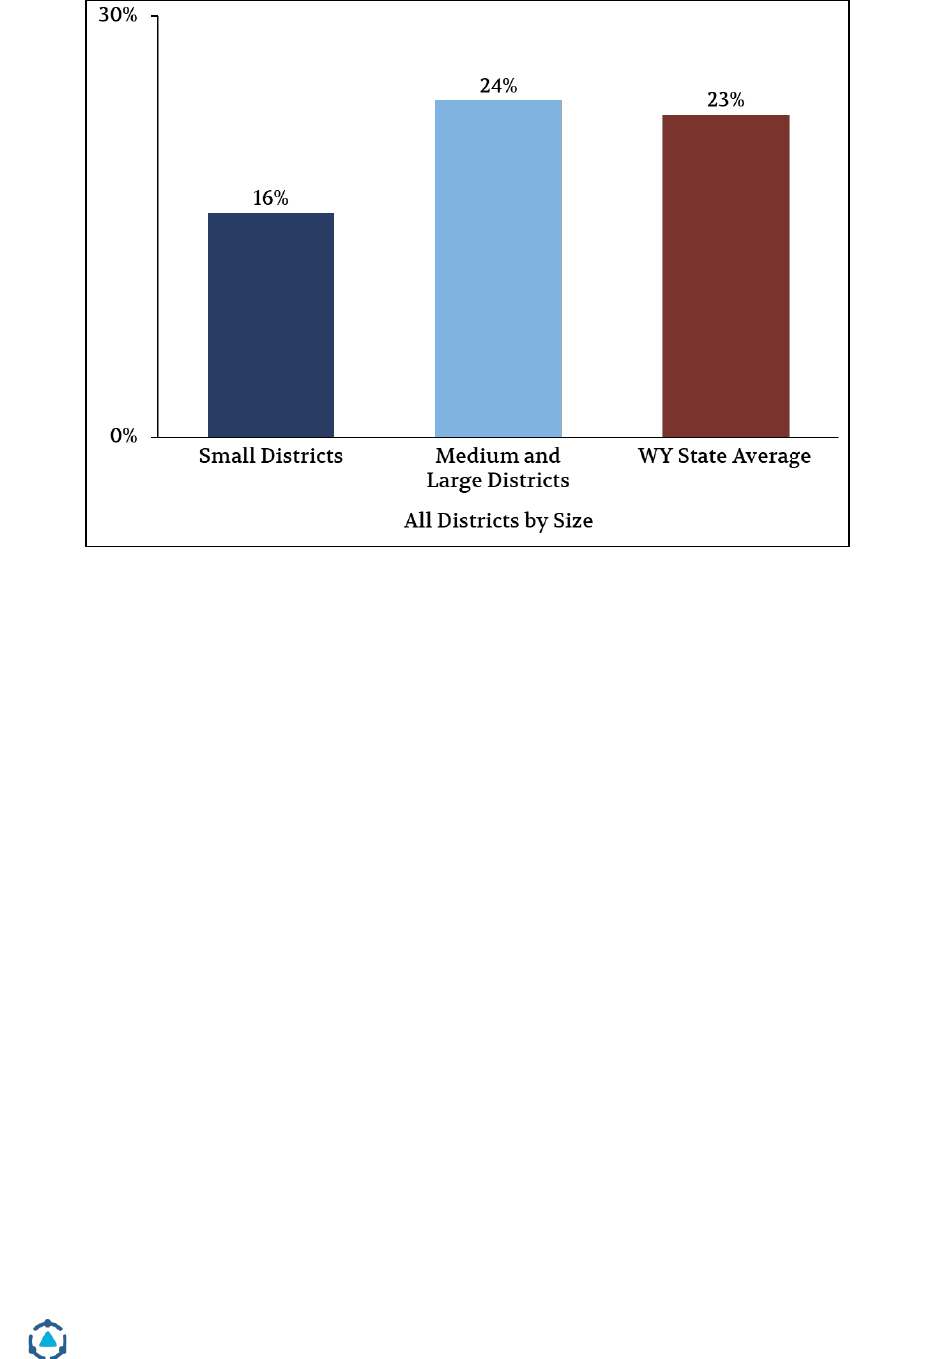
District Management Group | Helping Schools and Students Thrive | www.dmgroupK12.com
101
Figure 40. Percent of special education teacher time in self-contained settings.
Source: Schedule sharing data.
Additionally, as shown in Figure 41, groups of students in these self-contained
classrooms were generally smaller in small districts than those in medium and
large districts. This and the percent of time special education teachers worked in
self-contained classrooms indicates that small districts had less specialized, self-
contained programs and have fewer students in those classrooms.
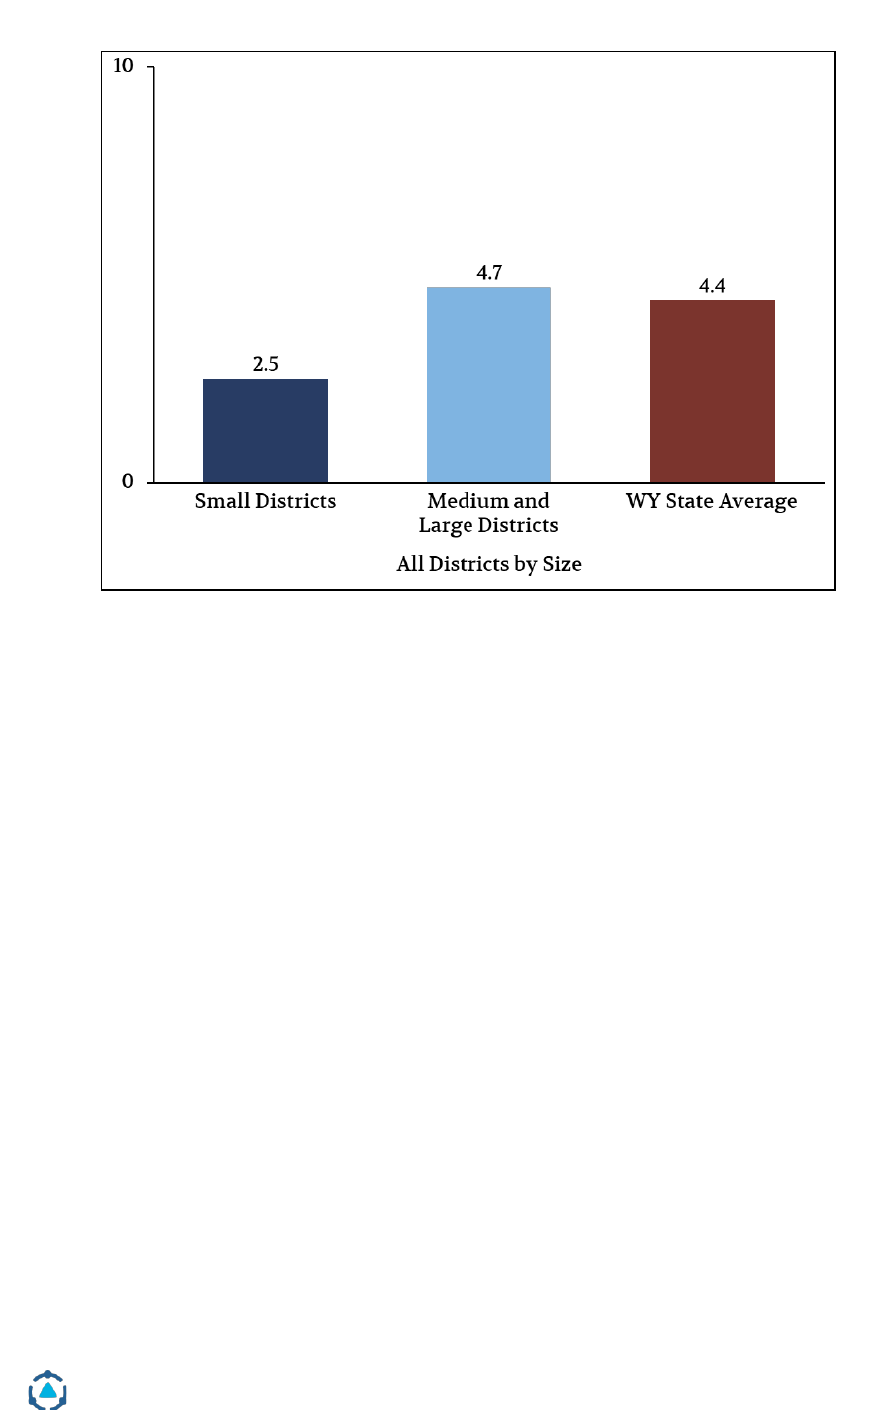
District Management Group | Helping Schools and Students Thrive | www.dmgroupK12.com
102
Figure 41. Average number of students in self-contained groups.
Source: Schedule sharing data.
Overall, as shown in Figure 42, small districts spent a higher percent of their
special education budget on out of district placements than medium or large
districts. While small districts, on average, spent almost double the percent (11%
compared to 6%) of their special education budget on out of district placements
than medium and large districts, this difference becomes more pronounced
when isolating only the districts that placed students out of district. Small
districts that spent money on out of district placements, on average, spent about
15% of their special education dollars on out of district placements, while
medium and large districts still spent about 6% of their special education dollars
on out of district placements.
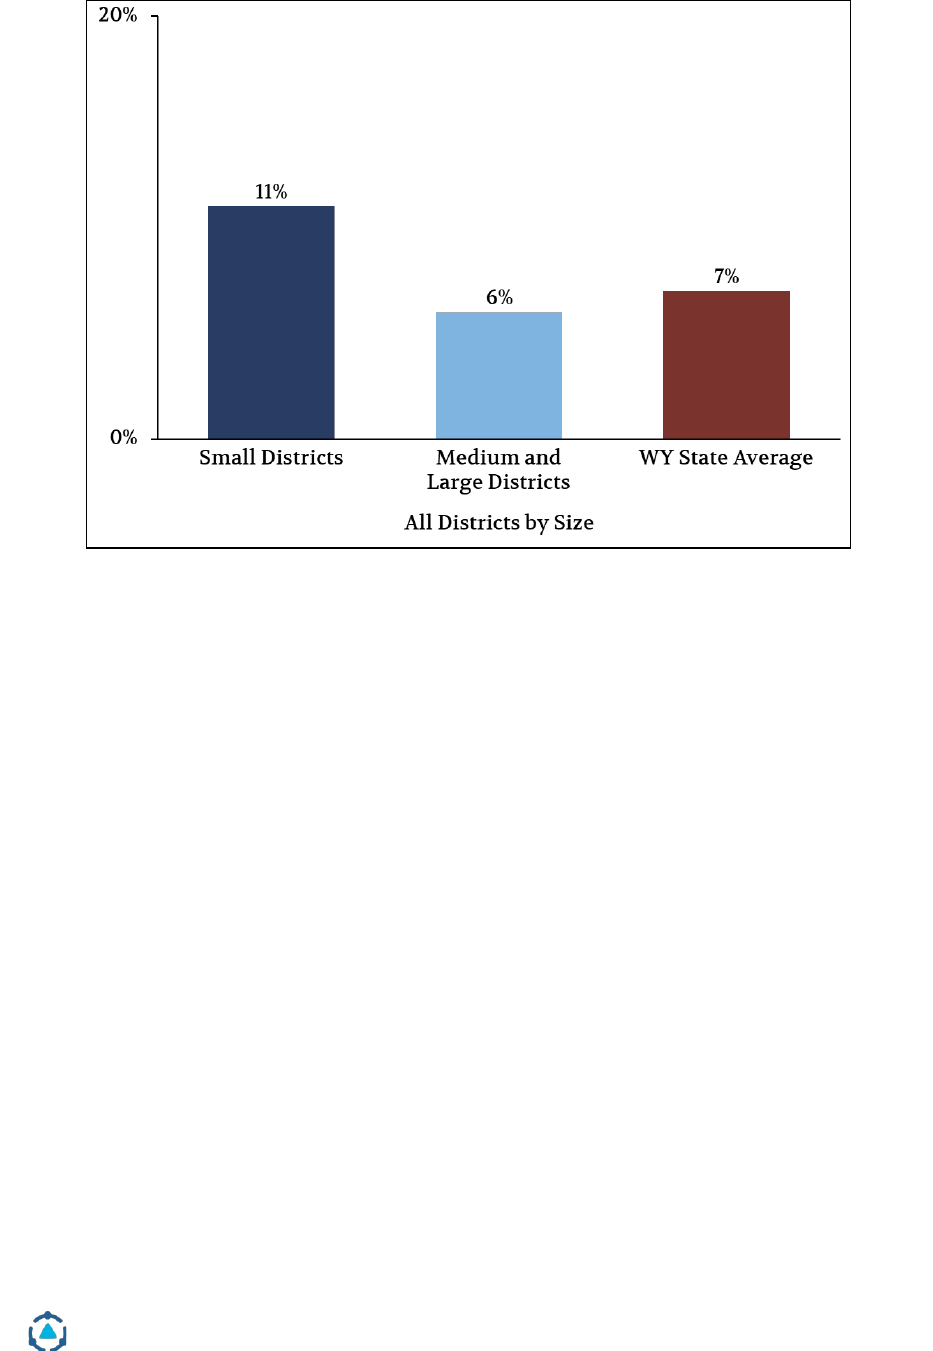
District Management Group | Helping Schools and Students Thrive | www.dmgroupK12.com
103
Figure 42. Percent of special education budget spent on out of district costs.
Source: WDE Special education expenditure report.
All of this information together indicates that smaller districts across Wyoming
may have struggled with high quality, cost-effective specialized programs for
students with more severe needs.
Focus group and interview participants indicated that this is true in many
smaller districts. Participants in one district noted that they only had one
specialized program and it was for students with behavior challenges, so when a
student is in need of a different type of program they must adapt and update
what they provide.
In another district, the only self-contained classroom was for students who are
academically low and only had one student in that classroom. To staff that
classroom, there was a half time special education teacher and a
paraprofessional who covers the non-academic parts of the day. For this student,
they did not have access to a full time highly trained staff member and instead
received some support from a paraprofessional in the place of a teacher.

District Management Group | Helping Schools and Students Thrive | www.dmgroupK12.com
104
How Can Districts Use a Regional Approach to Solve This Challenge?
To establish best practice specialized special education programs for students
with more severe needs in smaller districts, Wyoming districts can consider
taking a regional approach to these challenges. In a regional program, districts
that are within proximity of one another would set up specialized programs for
students across multiple districts. These programs would require tuition from
neighboring districts, but tuition would be less expensive than an out-of-district
placement, as they are covering just the proportion of the program costs for that
student.
One potential way of helping facilitate these specialized programs is through
Boards of Cooperative Education Services (BOCES), as their purpose includes
“provide a method whereby school districts and community college districts or
any combination may work together and cooperate to provide educational
services, including…services for children with disabilities, when the services
can be more effectively provided through a cooperative effort.”
25
However, these programs should be hosted at a specific district rather than at a
regional facility, to provide opportunity for inclusion with non-disabled peers
and to reduce facilities costs.
There are a few key benefits to holding these programs regionally:
● Students can be grouped together based on specific need and age across
multiple districts
● Students can access inclusion in general education settings when it’s
appropriate, as these programs are hosted at a district.
● Programs can be well-established with specialized and highly trained staff
and appropriate materials.
● With programs serving at least three to four students, programs can
become more cost-effective for participating districts.
25
Wyoming Statute 21-20-102
District Management Group | Helping Schools and Students Thrive | www.dmgroupK12.com
105
The Challenge with Handling Intensive Behaviors in Wyoming Small Districts
Opportunity #5 outlines a best practice, multi-tiered approach to social,
emotional, and behavioral supports and how districts can better implement this
approach through district-wide structures and systems. However, as outlined
above, small districts face acute challenges of supporting students with more
specialized needs, including students requiring intensive Tier 3 behavior
supports. This is largely because of the required training and specialization of
staff members to handle these behaviors. Behavior management is a science
requiring very specialized training, skills and aptitude. Board Certified Behavior
Analysts (BCBA), are one such example of a behavior management expert.
Across small districts in Wyoming, there were only 5.5 FTE school psychologists
fully employed in the 2018-19 school year.
26
Many districts had to contract out for
psychologist and behavioral support. Additionally, in the entire state of
Wyoming, there are only 21 registered BCBAs.
27
However, not all BCBAs work in
public schools and districts across the state, many may work in hospitals,
nonprofits, mental health centers, and government agencies. There were no
BCBAs noted in Wyoming’s special education expenditure report or CRERW
report.
Focus group and interview participants from small districts noted a challenge of
handling students with more significant behavioral needs in their districts,
schools, and classrooms. One psychologist in a small district noted that behavior
crisis management was the biggest challenge for her in the district. “Whenever
we have kid with a blow up, they often hold the whole building hostage. It can
take the entire day to deescalate the situation.” This staff member noted that
because they are a small district, they did not have behavior experts to handle
these crises and the psychologists are already stretched thin across the district.
In another small district, almost every focus group and interview participant
noted that behavior was top of mind as a challenge. In this district, they added a
behavior specialist and special education teachers, but still instructional coaches
and school administrators were pulled in to handle behavioral crises. One staff
member in this district said, “Our general education teachers are not equipped to
26
Wyoming Special Education Expenditure Report
27
Behavior Analyst Certification Board, BACB Certificant Registry.
(https://www.bacb.com/services/o.php?page=100155)
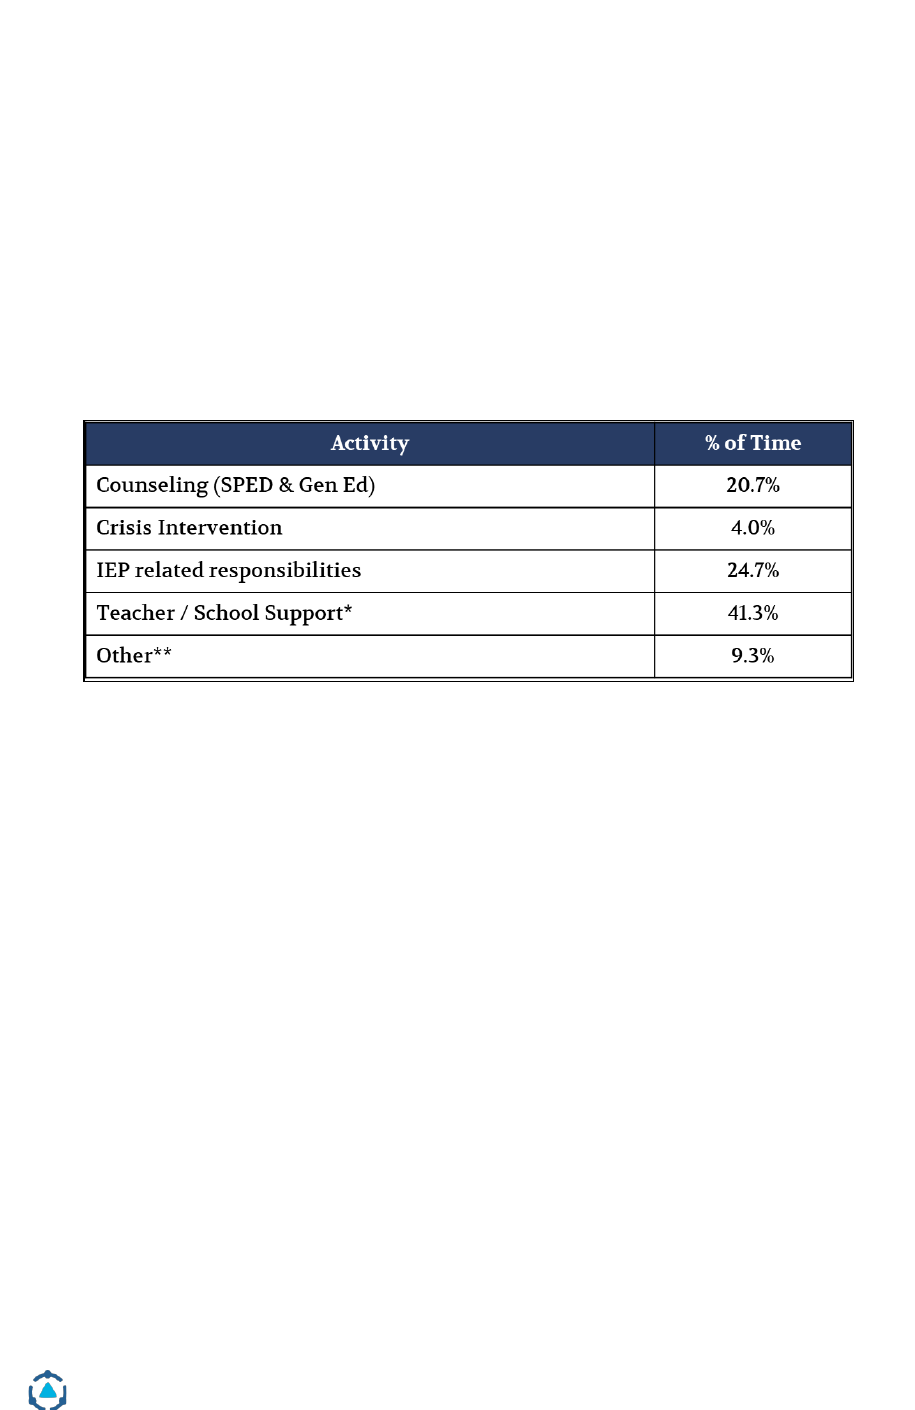
District Management Group | Helping Schools and Students Thrive | www.dmgroupK12.com
106
handle the intense needs, but we struggle to find qualified people who can
provide the services or trainings.”
As noted in Figure 43, psychologists in small districts had many different tasks
on their plate and spent only about 20% of their time directly counseling
students and only about 4% of their time in crisis intervention. They generally
spent a majority of their time in various support roles or IEP coordination.
Psychologists are often the most trained to support students with more severe
behavioral needs, but only spent 24% of their time in counseling and crisis
support.
Figure 43. School psychologist time breakdown in small districts.
Source: Schedule sharing data. *Teacher / School Support includes: Student observation, collaboration
with colleagues, planning/materials preparation, attending meetings, parent communication, 504
responsibilities, paperwork, and agency coordination. **Other includes: Personal lunch, travel between
schools/transition time, assigned school duties, and over/under reported time.
Figure 44 shows that school counselors were doing more counseling with
students than psychologists, with about 45% of their reported time. However,
counselors may not be behavioral experts to provide intensive supports and
interventions for students with severe behavior challenges.
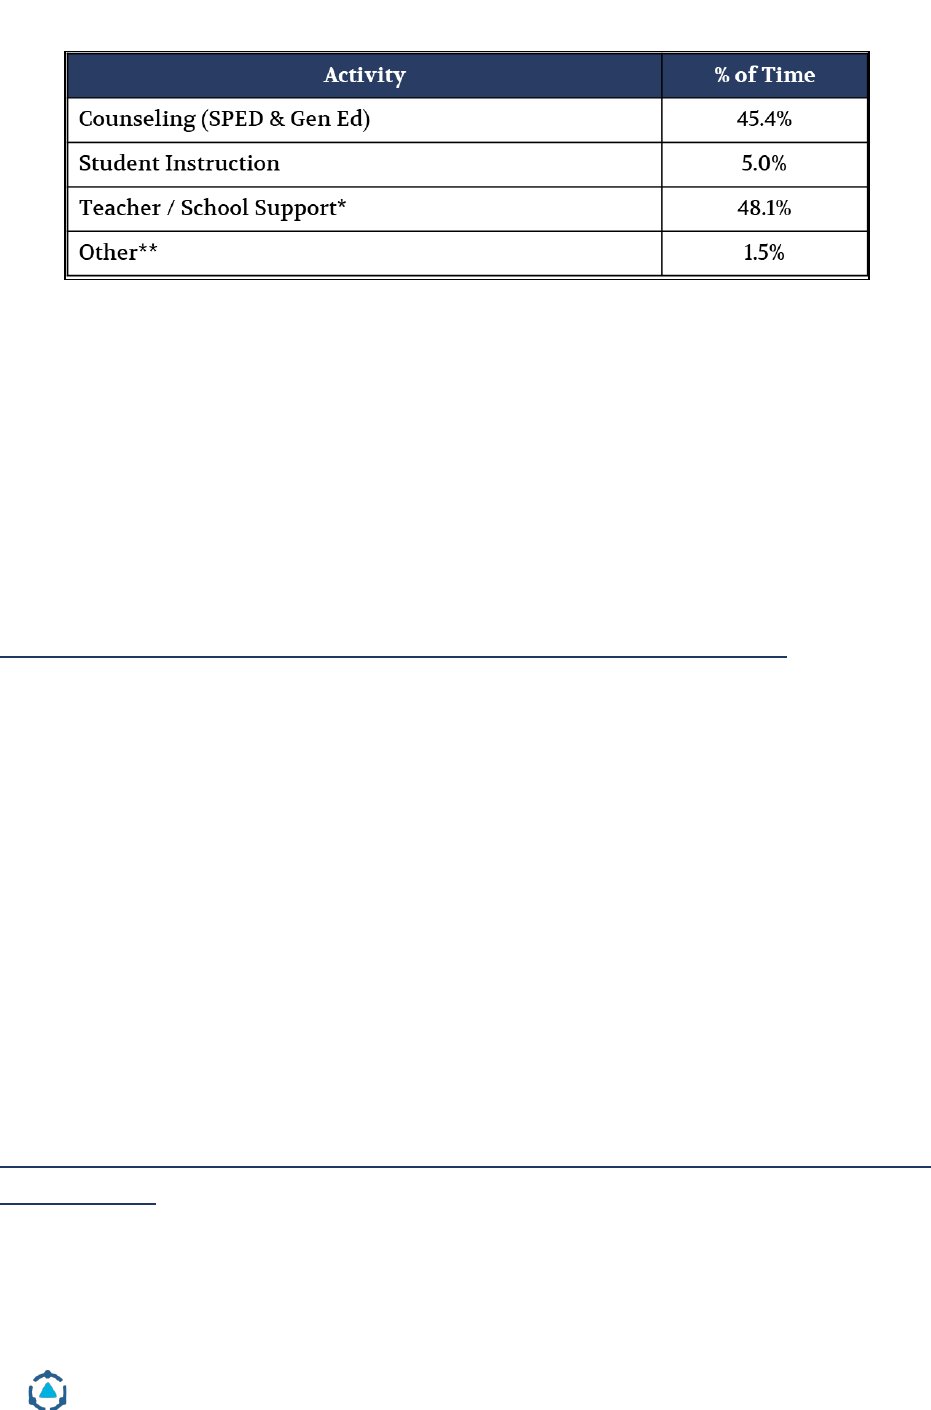
District Management Group | Helping Schools and Students Thrive | www.dmgroupK12.com
107
Figure 44. School counselor time breakdown in small districts.
Source: Schedule sharing data. *Teacher / School Support includes: Student observation, collaboration
with colleagues, planning/materials preparation, attending meetings, parent communication, IEP
responsibilities, paperwork, and agency coordination. **Other includes: Personal lunch, travel between
schools/transition time, assigned school duties, and over/under reported time.
When small districts supported students with more intensive behavioral needs,
these supports were often resource intensive, not provided from a behavioral
expert, or were provided outside of the district. As demonstrated in Figure 42,
small districts spent a higher portion of their special education budget on out of
district costs.
How Can Districts Use a Regional Approach to Solve This Challenge?
One way of addressing this challenge is to create regional teams of behavior
specialists that are partly funded by each school district or by the state to
provide supports to schools and districts as needs arise. This Regional Behavior
Response Team (RBRT) can be deployed to districts to handle the most
challenging needs and guide school-based staff. These teams should include
highly trained and specialized staff members who are deployed to districts to
support students with severe needs. Some potential members could include:
BCBA, Registered Behavior Technicians, school psychologists, or special
education teachers with behavioral management expertise.
As noted earlier, one way of assembling and deploying these RBRTs is through
BOCES. However, districts may find it easier to create smaller collaborative
groups of districts to assemble RBRTs.
How is Taking a Regional Approach to Intensive Services in Small Districts Better
for Students?

District Management Group | Helping Schools and Students Thrive | www.dmgroupK12.com
108
Serving students with more intensive needs in regional specialized programs
and through RBRTs is beneficial for students for a few reasons:
● Students are more likely to access higher quality programs specifically
designed for needs of students with similar needs at similar ages. This
allows staff to be specialized and trained to best offer high quality
supports to students.
● As opposed to out of district placements, students have access to inclusive
settings when it is appropriate for them because these programs are
hosted within the district and receive the benefits of partial inclusion with
general education populations.
• Students can access behavioral expertise from highly trained, skilled, and
qualified staff, especially in crisis situations.
How is Taking a Regional Approach to Intensive Services in Small Districts Better
for Staff?
Right now, many special education staff members in small districts switch
frequently between working in specialized programs and working with students
with mild to moderate disabilities. By creating these specialized programs,
special education teachers may benefit.
Special education teachers can specialize in specific programs or student needs
and can receive more targeted and tailored training to become experts in that
area. Teachers can specialize in behavior, functional life skills, intensive life
skills, or postsecondary transition.
Additionally, staff in a number of different roles can benefit from the creation of
RBRTs. Staff in small districts are already stretched thin with a number of
different responsibilities on their plates. Dealing with behavioral challenges and
crises only adds to the plates of these staff members and benefits staff in a
number of different roles:
• General education staff have more support for handling students with
challenging behaviors within their classrooms and schools.
• Administrators have clear protocols, procedures, and supports when a
student exhibits a more serious behavior at their schools.

District Management Group | Helping Schools and Students Thrive | www.dmgroupK12.com
109
• For special educators and support staff, RBRTs can provide many of the
supports that typically fall onto the role of the special educator or support
staff, even if these staff don’t have the training or expertise to provide
these supports.
• Additionally, staff in all roles can receive some training and support from
RBRT members to better handle challenges as they arise within the
district.
Is Taking a Regional Approach to Intensive Services in Small Districts More Cost-
Effective for Districts and the State?
Yes. Taking a regional approach to supporting students with more severe needs
and intensive behavioral needs is more cost-effective for districts across
Wyoming:
● Currently, small districts often have programs of three or fewer students.
By taking a regional approach, these programs can grow to the cost-
effective minimum of three to four students, without compromising the
unique needs of students requiring these programs.
● With more programs across multiple districts in a region, districts may be
able to reduce the number of students placed outside of the district and
instead pay a lower tuition rate for a regional program in another district.
● While RBRTs may not immediately reduce costs for districts and the state,
with better intensive behavior supports districts have potential
opportunities to reduce high cost out of district placements.
Steps to expand regionalized services
As shared above, a number of challenges could well served and cost effectively
served through a regional approach. By its very nature, a regional approach
requires cooperation and coordination. To accelerate the adoption of a reginal
approach a number of potential next steps exist.
● Fund a multi-district task force to identify the services best met by a
regional approach. The task force would include district representatives,
WDE and an independent facilitator. The task force would identify

District Management Group | Helping Schools and Students Thrive | www.dmgroupK12.com
110
specific needs by district and address logistical challenges posed by the
distances between districts.
● Provide seed money to new or existing entities to develop or expand
regional services. It is recommended that funds cover just research and
start up costs. Regional entities with entrepreneurial leaders and a
funding system that requires voluntary district participation are most
responsive and cost effective in the long run.
● Identify districts that wish to become a regional center supporting
surrounding districts. This district could receive start up funds to develop
services to serve more than just their own students. Start up funds could
be provided to these districts.

District Management Group | Helping Schools and Students Thrive | www.dmgroupK12.com
111
3. Assessing Special Education Funding
3a. Overview, Strengths, and Challenges of the Current Funding Model
As provided in Wyoming Statute 21-13-321, Wyoming has deployed a model for
special education funding in which 100% of allowable district special education
expenditures are reimbursed by the state. This means that all special education
expenses incurred by a school district are reimbursed during the following
fiscal year. Districts must report special education program expenditures, which
are reviewed annually by WDE and required to be reported to the joint education
interim committee about the services provided to students with disabilities by
school districts. WDE is responsible for conducting audits of school districts to
ensure compliance with state law and department rules and regulations.
There was a cap on the total amount reimbursed across the state of Wyoming, in
which the total expenditures for the 2019-20 and 2020-21 school years would not
exceed the statewide total amount reimbursed in the 2018-19 school year, plus $2
million for out of district placement costs.
28
This was a new initiative and did not
prevail in the years before 2018-19.
Below is an excerpt from Wyoming Statute describing the funding model for
Wyoming:
“The amount provided for special education within the education resource block grant
model pursuant to W.S. 21-13-309(m)(v)(E)(II) shall be equal to one hundred percent
(100%) of the amount actually expended by the district during the previous school year
for special education programs and services. The statewide total amount reimbursed
under this section in school year 2019-2020 or 2020-2021 shall not exceed the
statewide total amount reimbursed under this section in school year 2018-2019,
notwithstanding any additional appropriation for that purpose by the legislature.”
Strengths of the Model:
1. Wyoming’s reimbursement model provides districts the freedom to provide services
as the IEP team deems appropriate.
One of the greatest benefits of the reimbursement funding model for special
education was the flexibility it allowed school districts. With this model, school
28
2018 Wyoming Session Laws, Chapter 37, Section 6. https://wyoleg.gov/2018/SessionLaws.pdf#page=438

District Management Group | Helping Schools and Students Thrive | www.dmgroupK12.com
112
districts could be adaptive and responsive to student needs without focusing
heavily on tradeoffs within their resources. If a student had a specific need that
they didn’t already have programs or resources to address, the current funding
model allowed the district to provide these services without needing to take
away resources from other parts of the budget. School practitioners and district
leaders made the best decisions for students based on their understanding of
best practices.
Many districts were able to have more specialized programs, provide out of
district placements when appropriate, and could provide technology, materials,
and resources when needed. One administrator noted this across their district,
“When a student needs a specific piece of technology or program, we’re able to
get those resources to meet that student’s needs.” This sentiment is very
uncommon in most other states and districts across the country.
Another said, “When a student comes into our district with a specific need and
no advanced notice our response is ‘we’re going to find you a program,’ which
wasn’t always the case in prior funding models.” This is especially important in
smaller and more rural districts where a few students moving in or out of the
district makes a large impact on the special education services and costs.
Many administrators and state officials noted that this flexibility in spending
has reduced legal action taken against schools and districts by allowing them to
provide adequate services to students with disabilities.
2. Decision making for spending lives closest to the students, at the district, principal,
and practitioner level.
Districts noted that with the reimbursement model, decision making for
spending was closest to the needs of the students. While the state provided
guidance and oversight for school districts’ special education models and
services, districts and schools were able to make decisions for services and its
related spending based on their perception of student need and understanding
of best practices.
While district administrators often made large-scale decisions, principals and
practitioners themselves could also make requests for funding related to
student need which could be granted by the district because of the
reimbursement model. “[The reimbursement model] empowers the IEP teams to
do the right thing and make decisions about what’s best for the students,” one

District Management Group | Helping Schools and Students Thrive | www.dmgroupK12.com
113
administrator noted. Another said, “I have the resources I need to help support
special education practices at the building level.” Again, this sense of having
what students need is uncommon in most schools in other states.
This level of freedom to design supports works best when staff, schools, and
districts are aware of and embrace research proven best practices. With this in
mind, as outlined in the teaching and learning section of this report, services for
students with special needs could be more closely aligned to best practices to
better meet student needs at a lower cost. With this in mind, local educators
would need to restructure thinking about the current use of co-teaching and
paraprofessionals to provide academic extra help, and shift to extra time
interventions with content expert teachers to provide extra academic support.
3. Wyoming culture, coupled with the cap on special education spending, has
encouraged districts to be fiscally responsible with special education dollars. Because of
this, school districts did not over-identify students with disabilities and did not
substantially increase spending year-over-year.
Even with a 100% reimbursement model, district leaders felt a need and desire to
be fiscally responsible with special education dollars. In many interviews,
district administrators claimed to be good stewards of taxpayer dollars and
sought to work to ensure that efficiency was also a priority for special education
spending.
The cap on special education spending has encouraged school districts to be
fiscally minded and has created a meaningful limit on overspending, while
having limited impact on district budgets or services provided to students.
Stakeholders from WDE and districts shared that since the cap has been placed
on special education funding the maximum amount statewide that was
exceeded was just over $300,000 for amounts reimbursed during school year
2019-20. This was split among multiple districts, so the largest amount any one
district was not reimbursed was about $50,000. While stakeholders at districts
expressed that the cap has put fiscal pressure and stress on districts in a
negative way, the actual fiscal ramifications have been minimal.
Additionally, Wyoming districts have not identified more students with
disabilities than other states around the country. A 100% reimbursement model
could encourage overidentification, but it has not in Wyoming. One
administrator made this point, “100% reimbursement is not an open checkbook.
If it was, you would expect to see much higher identification rates from district.”

District Management Group | Helping Schools and Students Thrive | www.dmgroupK12.com
114
During the 2018-19 school year, Wyoming school districts identified 14.2% of
students in the state as students with disabilities. In that same school year, the
national identification rate was 14.0%, indicating that Wyoming was right in line
with the national average (see Figure 1).
When compared to similar districts across the country and adjusted for
enrollment, Wyoming districts generally had a similar number of special
education teachers, one of the biggest drivers of costs. DMGroup compared ten
representative Wyoming districts across against national benchmarks and
found that these districts, on average, had the same number of special education
teachers as the benchmark districts (see Figure 45).
Figure 45. District special education staffing levels compared to benchmark
districts.
District
Letter
District Number of
Special Education
Teachers per 1,000
Students
Benchmark Number of
Special Education
Teachers per 1,000
Students
Benchmark
A
13.9
12.9
1.1x
B
11.6
10.5
1.1x
C
13.4
10.8
1.3x
D
9.9
11.2
0.9x
E
10.3
16.0
0.6x
F
9,1
10.1
0.9x
G
15.3
10.7
1.4x
H
10.4
10.8
1.0x
I
10.6
9.9
1.1x
J
13.5
9.8
1.4x
Avg.
11.8
11.4
1.0x
Source: WDE special education expenditure report and DMGroup benchmarking. Similar districts are
based on size, per pupil spending, and special education identification rates.

District Management Group | Helping Schools and Students Thrive | www.dmgroupK12.com
115
Challenges of the Model:
1. Wyoming’s average additional per pupil expenditures for students with disabilities was
higher than the national average, both in absolute terms and relative to general education
spending, but has not led to above average outcomes.
Special education spending per student with a disability across Wyoming has
plateaued at a relatively high level. Wyoming’s average additional per pupil
expenditures for students with disabilities was $18,637 in the 2018-19 fiscal year,
based on the Special Education Expenditure Report. However, this report only
includes state funded expenditures for special education, federal funding adds
$2,005 per pupil. This increases the total estimated per pupil special education
spending to $20,641.
There is no definitive benchmark for what is an appropriate level of additional
spending per student with a disability. Context such as size of school/district,
general cost of living, cost of general education and mix of student needs all
impact the question, “What is a reasonable level of spending?” Some good touch
points are:
• In the most comprehensive study, Tammy Kolbe and Kieran Killeen
reviewed the national average additional per pupil expenditures for
students with disabilities calculated the extra cost to be between $11,000
and $14,000 per IEP.
29
• Another study by Kolbe (2019) noted that the average incremental cost of
educating a student with an IEP is about 0.9 times the typical general
education student.
30
Based on this formula, Wyoming’s additional per
pupil expenditures for students with disabilities should be about $15,670
and it is significantly higher than that.
31
Both of these benchmark studies include special education expenditures from
all funding sources (local, state, and federal).
29
Kolbe, T., Killeen, K.. Study of Vermont State Funding for Special Education.
30
Kolbe, T. (2019). Funding Special Education: Charting a Path that Confronts Complexity and Crafts
Coherence. Boulder, CO: National Education Policy Center. Retrieved from
http://nepc.colorado.edu/publication/special-ed (page 18).
31
Wyoming CRERW report

District Management Group | Helping Schools and Students Thrive | www.dmgroupK12.com
116
Figure 46. Wyoming per pupil special education spending compared to
benchmark studies.
Benchmark Study 1: Kolbe &
Killeen
Benchmark Study 2: Kolbe
(2019)
Wyoming Per
Pupil
Spending
Additional
Per Pupil
Spending
Percent
Difference
from
Wyoming
Additional
Per Pupil
Spending
Percent
Difference
from
Wyoming
$18,637
(State dollars
only)
$11,000 -
$14,000
33%
$15,670
19%
$20,641
(State and
estimated
federal
dollars)
$11,000 -
$14,000
48%
$15,670
32%
SOURCE: WDE Special Education Expenditure Report; WDE CRERW Report; Wyoming MOE and CEIS
Reporting Requirements (FY17); Benchmark studies by Kolbe & Killeen.
Wyoming’s per pupil special education spending was higher than the national
average by about 20% when only including state funds, or about 30% when
including estimated federal funds. This may have been in part due to the
practices across the state, as noted throughout the teaching and learning section
of this report, and may also have been in part due to the rural nature of
Wyoming and the additional challenges of providing special education services
in small schools and small districts. Stakeholders across Wyoming noted that
the reimbursement model reduces litigation costs to districts and the state.
There is no national benchmark of litigation costs associated with special
education. While it may be true that litigation is reduced due to the
reimbursement model, the reduction in litigation costs does not balance out the
higher per pupil spending in Wyoming. Many states and districts with less
generous special education funding have low spending on special education
litigation, often just 1% or 2 of special education spending.
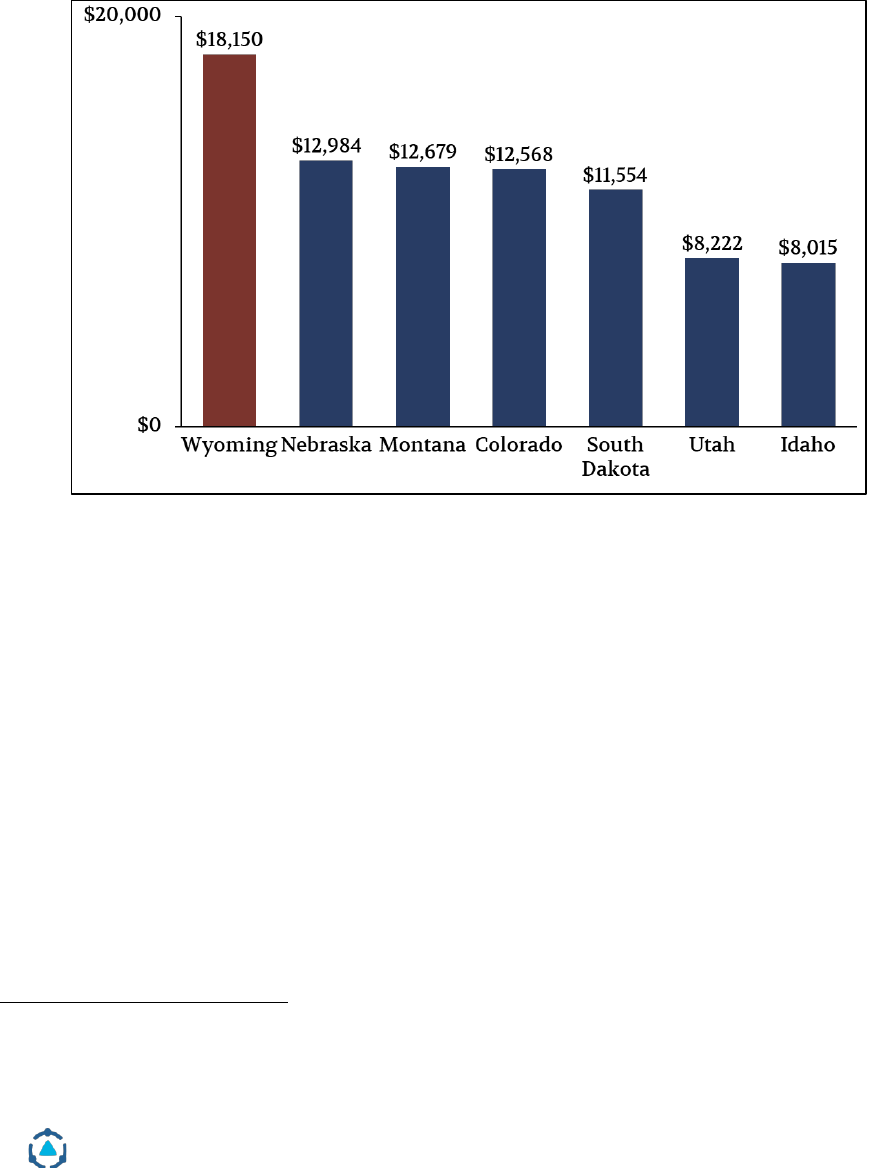
District Management Group | Helping Schools and Students Thrive | www.dmgroupK12.com
117
There is no national database of incremental special education per pupil
expenditures, so it is impossible to directly compare Wyoming’s per pupil
special education expenditures to surrounding states. However, Wyoming’s
overall per pupil spending is higher than its neighboring states (see Figure 47).
Figure 47. Wyoming total per pupil expenditures compared to surrounding
states (2018-19).
Source: National Education Association Ranking of the States 2019 and Estimate of School Statistics
2020. Public School Current Expenditures Per Student in Average Daily Attendance.
Another rural state, Vermont, spent even more than Wyoming per pupil on
incremental special education costs; in FY2016, Vermont districts, on average
spent over $20,000.
32
Vermont, however, has launched an aggressive effort to
reduce special education costs by shifting more instruction to general education
certified teachers, embracing the best practices recommended in this report and
the EB model, and blending special education and general education funds when
appropriate. The Vermont legislature recently adopted reforms aligned to the
teaching and learning best practices of utilizing content strong staff, extra time
for intervention, an emphasis on strong Tier 1 instruction, and a focus on social-
emotional supports for students to improve outcomes for students. These
changes are still a work in progress; reforms are being implemented slowly and
32
Kolbe, T., Killeen, K.. Study of Vermont State Funding for Special Education.

District Management Group | Helping Schools and Students Thrive | www.dmgroupK12.com
118
deliberately to ensure maintenance of effort is maintained at the state and local
level and to give districts time to change their practices.
Moreover, Wyoming’s higher spending has not led to higher outcomes for
students. The state has been flagged by the US Department of Education for
persistent achievement gaps for students with special needs and the WDE is
equally concerned with the academic outcomes for students with disabilities.
Changing how funds are spent will be instrumental in closing the achievement
gap to implement best practices, like strong Tier 1 instruction, extra time for
intervention from content experts, and preventative social-emotional supports.
Fortunately, these best practices are also lower cost.
With this, it’s important to note that spending across Wyoming on students with
disabilities is not growing. While there is reason for concern regarding the total
amount of incremental dollars spent on students with disabilities, unlike many
other states, spending of state funded dollars has plateaued around a total of
$246,000,000, or $18,600 per pupil (see Figures 4 and 5).
2. The reimbursement model has unintentionally discouraged general education
support for students with disabilities, even though such support is a best practice for
closing the achievement gap and fiscal efficiency.
(The Wyoming funding model includes multiple mechanisms that should mitigate this
drawback, but unfortunately, they haven't had the desired effect.)
By nature, a model that reimburses expenses only tied to special education
services can discourage general education supports for students with IEPs, given
that this type of support might not be reimbursed, thus making it much more
costly to the district, even if it less costly to the state and better for students. This
can lead to students with similar needs being served in very different ways due
to their IEP status.
In focus groups and interviews, DMGroup heard a few examples of how this
plays out in schools and districts:
● In some districts there were separate systems/staff for counselors who
support students with disabilities and students without disabilities. There
may have been similar needs across these two groups of students, but who
served them for mental health or behavioral needs is separate. This raises
costs. Additionally, students may benefit from group counseling that
includes students with and without IEPs in the same group; however, with

District Management Group | Helping Schools and Students Thrive | www.dmgroupK12.com
119
a reimbursement model, students may have been separated based on IEP
status.
● In some districts with highly skilled interventionists and/or tutors, these
staff members only supported general education students, while special
education teachers and paraprofessionals supported students with
disabilities. However, the interventionist may have been the content
expert and better equipped to provide interventions to many students
with disabilities than the special education teacher or paraprofessional.
For example, one elementary general education teacher in a district noted
that during her class’ intervention period students needing intervention
without IEPs got support from the certified tutor and students with IEPs
received supports from the special education teacher or a noncertified
paraprofessional, neither of whom may be specifically trained in reading.
The existence of an IEP may not be the best marker of which students
should receive support from which staff members.
While there is a procedure available to get reimbursement for general education
staff who work with students in both general education and special education,
this procedure can be cumbersome for staff and districts and therefore was only
used on very limited basis.
3. The reimbursement model creates short term financial challenges for districts when
new students with severe, high cost needs, move into a district. While fund balances
typically cover these costs until reimbursement is provided the following year, it
creates some concern at the district level and creates a sense that special education
spending is hard to manage tightly.
Because the Wyoming model reimburses special education costs in the
following fiscal year, the movement of high cost, high needs students has added
a financial burden on districts around the state in the year costs are first
incurred. If just one or two students in residential placements or out of district
programs moved into a school district, then the district was responsible for
finding funds to cover the expenses associated with educating those students
until the following fiscal year. For small districts, this can be challenging.
Interviews with district leaders articulated this challenge for their districts. In
one large district, the business manager noted that their district has kept a
“contingency fund” for the influx of students requiring out of district

District Management Group | Helping Schools and Students Thrive | www.dmgroupK12.com
120
placements, as “it’s unknown when drops or spikes will happen, even in the
middle of the school year.” With this contingency fund, the district did not need
to dip into their general fund dollars or reserves to cover the cost of these high
needs students until the reimbursement comes through.
In smaller districts, however, it was much harder to set aside funds for high
needs students that may move into the district. One business manager said, “We
have to dip into our reserves if a student with severe needs moves into our
district.” These districts were faced with short-term, but immediate fiscal
challenges when only one student moves into their district because they had to
wait a year for the reimbursement.
Perhaps the greatest drawback of the delayed reimbursement of high needs
students isn't financial, but psychological. The concern and reality that it is hard
to budget for meeting the needs of students with severe needs leads to a sense
that controlling special education spending at the district level is difficult,
because a single new student can exceed the budget. This sense of hard to
control spending is realistic for students with severe needs, but not so for the
larger number of students with mild to moderate needs. Because both groups of
students are funded together, the unpredictability of high needs students can
lead to a broader sense of unpredictability for all of special education.
While reserves and contingency funds ultimately allowed districts to handle
these challenges, the state may be able to consider different ways of handling
high cost, high needs students in order to create a better context for managing
all special education spending.
4. There are few to no incentives to encourage deploying resources towards more
cost-effective best practices.
One strength of Wyoming’s reimbursement model is that it allows for flexibility
of spending and decision making to live at the district, school, and practitioner
level. However, there are very few pressures in place to encourage districts to
deploy resources towards evidence-based best practices that cost less (and serve
students better). In many districts in other states fiscal pressures have
encouraged districts to more aggressively ask the question, "Can we do better for
less?"
A few examples of where funding has not led to the implementation of best
practices include:

District Management Group | Helping Schools and Students Thrive | www.dmgroupK12.com
121
● The co-teaching model used by many districts state-wide is one of the
most expensive practices for serving students with special needs, but has
not raised student achievement in national studies.
33
For more
information on the challenges of co-teaching, see Teaching and Learning
Opportunity #3. In states without 100% reimbursement models high cost
practices are more likely to be reviewed for effectiveness.
● Many districts were quick to add paraprofessionals to support the
academic needs of students, a practice that research has shown to be
ineffective in many cases of students with mild to moderate disabilities,
because paraprofessionals are not trained to address the academic needs
of students. While they can effectively provide the health and safety
related support, behavior support and many services to students with
severe disabilities the addition of a paraprofessional alone does not
increase the achievement of students with mild to moderate disabilities
and often decreases student outcomes.
Wyoming districts spent a higher percent of their special education staffing
budget on paraprofessionals than other districts across the country. When
comparing the distribution of the proportion of dollars spent on special
education teachers vs. special education paraprofessionals, Wyoming districts
spent a higher proportion of their dollars on special education
paraprofessionals than a national benchmark
34
by almost double and best
practice by almost triple (see Figure 48).
35
33
Jones, Nathan, Vaughn Sharon, Fuchs Lynn. Academic Supports for Students with Disabilities.
34
Levenson, Nathan (2012). Boosting the Quality and Efficiency of Special Education. Thomas B. Fordham
Institute.
35
In a best practice model, not all teacher spending needs to be on special education certified teachers, but
can also be on general education certified teachers.
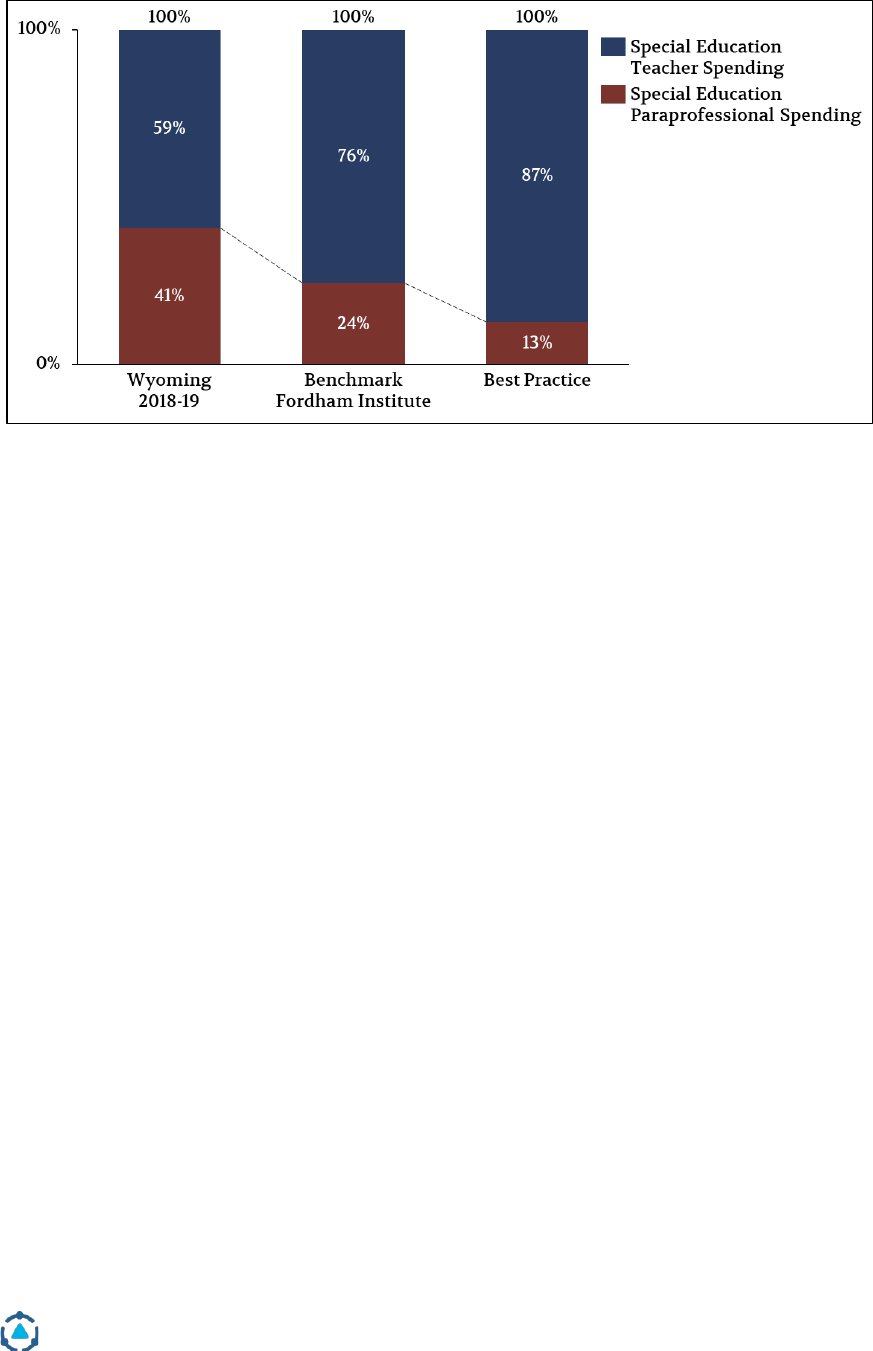
District Management Group | Helping Schools and Students Thrive | www.dmgroupK12.com
122
Figure 48. Distribution of special education teacher vs. paraprofessional costs.
Source: WDE Special Education Expenditure Report. Special Education Teacher dollars include
personnel assignments for Arts (XAR), Alternative Core Standards (includes Life Standards; XAS), Civics
and Government (XCG), Case Manager (XCM), Economics (XEC), Elementary Grades (XEL), English
(XEN), Foreign Language (XFL), Geography (XGE), History (XHI), Language Arts (XLA), Math (XMA),
Reading (XRD), Science (XSC), Secondary (XSD), Behavior / Emotional / Cognitive / Learning Disability
(XXB), Deaf/Hard of Heading – Teacher not of record (XXD), Visual Disability – Teacher not of record
(XXV), Core and/or Non-Core Subjects – Teacher not of record (XYN). Special Education
Paraprofessional dollars include Special Education Aide (SEA) and Related Services Aide (RSA).
Additionally, when compared to similar districts across the country and adjusted
for enrollment, Wyoming districts generally had more paraprofessionals than
other districts. DMGroup compared ten representative districts across against
national benchmarks and found that nine of the ten districts have more
paraprofessionals than their benchmark districts, and, on average, Wyoming
districts had 1.4 times the number of paraprofessionals than their benchmark
districts (see Figure 49).

District Management Group | Helping Schools and Students Thrive | www.dmgroupK12.com
123
Figure 49. District special education paraprofessional staffing levels compared
to benchmark districts.
District
Letter
District Number of
Special Education
Paraprofessionals per
1,000 Students
Benchmark Number of
Special Education
Paraprofessionals per
1,000 Students
Benchmark
A
23.0
16.9
1.4x
B
19/5
13.7
1.4x
C
24.2
14.0
1.7x
D
13.4
14.6
0.9x
E
31.7
20.9
1.5x
F
14.7
13.2
1.1x
G
15.9
14.0
1.1x
H
15.6
14.1
1.1x
I
23.3
12.9
1.8x
J
23.4
12.8
1.8x
Avg.
20.5
14.7
1.4x
Source: WDE Special Education Expenditure Report and DMGroup benchmarking. Similar districts are
based on size, per pupil spending, and special education identification rates. 90% of districts
benchmarked had more paraprofessionals per 1,000 students than benchmark districts.
5. Wyoming’s model provides few incentives to be fiscally or educationally creative,
potentially leading to over-identification or over-spending in special education in the
future.
Even though Wyoming did not overidentify students with disabilities, the
funding model itself provided few incentives for districts to be cost effective or
to limit overidentification and/or overspending on special education. While
districts did not claim to view the reimbursement model as a “blank check,”
there is little that could stop future administrators from acting that way. This
could be more likely to happen if general education funding became tight.
Additionally, schools and districts have few incentives in the current model to be
educationally creative in their solutions and services for students.
Administrators who worked in other states with alternative models noted that

District Management Group | Helping Schools and Students Thrive | www.dmgroupK12.com
124
districts in these other states were forced to become more efficient with limited
resources or were required to align services to best practices outlined by the
state in order to receive funding. “I believe we provide better services for
students here in Wyoming, but when I worked in another state, we were forced
to be educationally and fiscally creative with our solutions for students,” said
one administrator.
Summary
Overall, the current reimbursement model serves students well, in terms of
ensuring resource limitations don't factor into IEP service decisions, but student
achievement has not benefited from the higher spending. In fact, the
reimbursement model has made it "easier" to adopt and maintain a number of
costly and ineffective service practices that are not aligned with best practices or
the EB model.
The financial incentives of higher spending of a 100% reimbursement have been
mitigated both by the cap, despite its limited actual impact, and desire to be good
fiscal stewards by district leaders.

District Management Group | Helping Schools and Students Thrive | www.dmgroupK12.com
125
3b. Overview of Alternative Special Education Funding Models
As part of the scope of this work, we compared alternative special education
funding models. These alternatives are not suggested as better or worse, just
different.
When the Individuals with Disabilities Education Act (IDEA) was signed into law
in 1975, children with disabilities were guaranteed access to a “free and
appropriate public education.” Despite this guarantee, no coherent policy
framework or funding mechanism was established to ensure that sufficient
resources were provided to local districts and schools to maintain high quality
special education programming. In fact, no consensus was formed on what
qualified as sufficient resources for special education programming.
Supplemental federal funding, appropriated through Part B of IDEA and loosely
calculated based on identified student need, typically amounts to 15% of actual
funding for special education services and varies in how states allocate
appropriations to local districts. For the remaining needed resources, states and
local districts are left to determine for themselves how to cover the costs of
special education. Due to the absence of federal guidance, 50 states have
developed 50 different and constantly evolving ways to determine how much
funding should be provided for special education programming and how costs
should be shared between the state and local districts.
Regardless of the specific funding model, states attempt to optimize three key
variables related to providing and funding special education services. These
variables are:
● Total Cost - How can a state manage the total cost of its special education
programming while ensuring adequate resources are provided to local
districts?
Through their funding models, states attempt to find an answer to the
questions of how much funding is sufficient for special education
programming and what is the responsibility of the local district or agency
to share some portion of those costs. The different funding models take
slightly different approaches, using top-down and bottoms-up
calculations and obligations to establish appropriate funding levels for
students. Once state obligations are set, the remaining expenses for
special education programming are the responsibility of the local district.

District Management Group | Helping Schools and Students Thrive | www.dmgroupK12.com
126
As the funding models are explored in greater detail, it would be wise to
consider the various strategies states use to calculate total need as well as
the safeguards they institute to prevent runaway costs. Additionally,
refined funding models note the variation in costs across student
disabilities and needs. Considering the methods that various states use to
monitor and cover the costs of intensive special education programs will
help to create a more thoughtful and responsive statewide funding
system.
● Identification Rates for Students with Disabilities - How can a state
discourage the over-identification of students with disabilities but not
discourage identifying 100% of students who need and deserve an IEP?
Inherent in a funding model that provides resources for a specific
population of students is the risk of overidentification. For example, if a
school were to receive more resources for a student identified as having a
disability, an incentive exists wherein schools might over-identify
students for special education services to boost funding. Students who
struggle could be inappropriately designated as having a disability
because of the potential for more funding.
Though schools may be well intentioned in their goal of providing more
support to their students, mis-categorizing students as having disabilities
who don't hurts their long term academic and lifetime success. Some
believe that overidentification is harmless, perhaps even beneficial as an
added boost. Research says otherwise. In a well-respected study in
Massachusetts, for example, the authors found that students who might
get an IEP in one district but not another (so called kids on the bubble) had
worse outcomes when they received an IEP. This may be because of
creating lower expectations by teachers, students and parents and reduced
time in core instruction.
36
It is helpful to remember that while the process of identifying if a student
has a disability is well established and utilizes many nationally normed
assessments, in reality the determination is very subjective based on
36
Thomas Hehir and Associates. (2012). Review of Special Education in the Commonwealth of
Massachusetts. Commissioned by the Massachusetts Department of Elementary and Secondary Education.
http://www.doe.mass.edu/sped/hehir/2012-04sped.docx

District Management Group | Helping Schools and Students Thrive | www.dmgroupK12.com
127
historic norms as well. Some states identify students at nearly twice the
rate of others. Funding for education in general and special education in
particular can influence what becomes common practice in determining
who has a disability.
Creating a structure to monitor identification rates is therefore essential.
As a point of reference, special education identification rates in Wyoming
districts range between 10% and 23% of enrollment. The statewide
identification rate is 14% of enrollment. Across the country identification
rates at the state level range from 9.2% to 19.2%.
37
In general, states employ a few direct and indirect strategies to safeguard
against overidentification. Many states will attempt to manage
overidentification by capping funding based on a specific percentage of
students enrolled in a district. Resources are guaranteed to a district for
up to a certain percentage of students with disabilities. For example,
Washington funds an additional amount for students with disabilities up
to a maximum of 13.5% of the reported student population. If a district has
a higher proportion of students with disabilities and needs additional
resources, that district could apply for a waiver to access additional
funding or fund it from their general operating budget.
States that do not use a cap on funding tied to special education
identification rates often indirectly manage identification rates by
tethering total funding to allocations from previous years. Connecting
district funding back to a previous year has the dual function of
controlling costs and removing the financial incentive for that district to
over-identify students for special education. In Utah, the State Board of
Education uses a district or charter school’s average number of students
with disabilities from the attendance records for the previous five years to
determine funding. It should be noted that without an appeals or high-
cost contingency reimbursement structure, such an approach could
disadvantage schools or districts that experience an influx of students
with disabilities. It also fails to consider the impact on districts with fast
growing or fast shrinking enrollment.
37
From “Special Education: Definition, Statistics, and Trends,” by M. Riser-Kositsky, 2019, Education Week,
https://www.edweek.org/ew/issues/special-populations/index.html.

District Management Group | Helping Schools and Students Thrive | www.dmgroupK12.com
128
● Allowable Expenditures - How can a state ensure that special education
resources are put towards high-quality, effective programming?
Federal IDEA legislation outlines how special education funding can and
should be used in support of students with disabilities. In most cases,
states provide their own supplementary guidance for how special
education funds can be used. Traditional special education funding
structures reinforce the creation of separate educational structures and
programming for students with disabilities, which frequently deprive
them of strong general education academic supports.
Changes in IDEA legislation and shifting mindsets are calling for using
special education funding to integrate programming with general
education that would lead to better outcomes as well as more efficient
uses of resources.
For example, consider a district attempting to support its students with
disabilities who are struggling with literacy. A more siloed interpretation
of IDEA might limit the district’s spending of special education dollars to
licensed special education teachers and paraprofessionals. While these
positions are clearly in support of special education, they frequently lack
the specific content expertise to support students with literacy. This
limited interpretation of IDEA would prevent students with disabilities
from receiving high-quality instruction tailored to their individual needs.
Instead, the district might consider using special education dollars in
tandem with general funds to cover the cost of a certified reading teacher,
who supports students in both general and special education.
The same situation could be applied to a reading curriculum. A district
with a siloed interpretation might purchase a separate reading curriculum
for special education to comply with their understanding of excess cost
restrictions, despite the fact that they already have a perfectly good
curriculum. Though well-intentioned, a separate, parallel reading
curriculum might be an ineffective use of resources that actually
undercuts the reading instruction occurring in the general education
setting. Students with disabilities would be taken through multiple
disjointed curricula, which often use different strategies and framing for
the same content and skills. Although both programs might be
independently effective, the partial implementation of multiple programs

District Management Group | Helping Schools and Students Thrive | www.dmgroupK12.com
129
often leads to an incoherent approach that makes learning harder for
students who are already coping with learning disabilities. State funding
models can improve the effectiveness of programming by ensuring that
allowable expenditures are consistent with educational best practices that
will improve outcomes for students.
Although different in how they design their funding models, each state
offers lessons for how different funding models can complicate,
discourage, skew, or reinforce local provision of special education
services. As Wyoming reflects on its approach to special education
funding, considering the national landscape can provide useful context
and guidance for how it might modify its funding model to optimize the
key variables related to providing special education supports and to be
more efficient and effective towards providing high-quality services for
its students.
Funding Models
Although each state’s approach to special education funding is unique, funding
models fit into four general categories based on how funding levels are
determined and the mechanisms by which funds are disbursed to specific
districts. This framework for special education funding models draws on the
work of Tammy Kolbe in her 2019 National Education Policy Center report. As
Kolbe notes, no single model is the best—the unique needs and strategies of
states drive the structure of their funding models, and each model has different
benefits and drawbacks. However, lessons can be drawn from the various
models to understand why strategies were employed and whether they were
effective in producing desired outcomes elsewhere and what they might mean
for Wyoming.
A summary of each of the four funding models is listed below.
A. Formula-based:
Formula-based funding is the most widely used funding model. At its core,
funding is determined by taking the proportion of students with disabilities in a
state or within individual districts and multiplying by an estimated additional
cost per student for special education services. Oftentimes, states will attempt to
refine their calculations based on factors such as disability type, educational
settings, or the estimated resources (i.e. staff) needed to maintain programming.

District Management Group | Helping Schools and Students Thrive | www.dmgroupK12.com
130
Within formula-based models, states calculate the core of their allocations using
three main mechanisms: single-weight, multiple-weight, and resource-based
formulas.
• Single-weight Formulas - States assign a specific weight or flat grant
amount based on the estimated additional cost to educate a student with
disabilities.
For example, Oregon applies a multiplier of 2.0 for students with
disabilities, meaning that for each reported student with a disability, a
district will receive double the per-student base amount. Oregon caps the
total amount of special education funding for a district at 11% of the total
average daily membership (ADM) of schools as a disincentive for districts
to overidentify students for disabilities.
For a district in Oregon with a total enrollment of 10,000 students
reporting 1,000 students with disabilities, where the base per student
funding is $4,500, the state would allocate an additional $4.5 million for
special education services, given that the 1,000 students represented equal
to or less than 11% of the ADM of the district.
Base Funding Allocation
$4,500
Total Students with Disabilities
x 1,000
Total Special Education Allocation
$4,500,000
For comparison, consider an equally sized district in Oregon that reports
1,400 students with disabilities, representing 14% of their average daily
membership. Because their identification rate exceeds the 11% cap, the
state would provide funding for up to 11% of the ADM, or 1,100 students.
Any requests for additional funding would need to be reviewed and
approved by the Oregon Department of Education.
• Multiple-weight Formulas – States assign a set of specific weights or
dollar amounts according to the type of disability a student may have or
based on their required educational setting to create a more tailored
funding allocation per district. The number and values of weights vary
from state to state often based on the larger system for funding education.
For instance, New Mexico uses four disability categories, which link to
funding weights that increase for more resource intensive disabilities.

District Management Group | Helping Schools and Students Thrive | www.dmgroupK12.com
131
Arizona employs a more complex system, with over 12 different weights
related to disability type.
In New Mexico, students with disabilities are classified into four
categories based on the severity of the disability. Those categories are
then assigned a resource weight consistent with estimated costs
associated with providing services—the more severe the need, the more
resources are provided. The allocation for a district is calculated by taking
the total number of students within each category and multiplying by the
corresponding weights, then taking the sum of the subtotals for each
category.
Consider a district in New Mexico with 1,000 students with disabilities,
distributed across the four disability categories in the following manner.
Category
Weight
Total Students
Category A – Mild
0.7
500
Category B – Moderate
0.7
300
Category C – Severe
1.0
150
Category D – Max Support
2.0
50
Given a program unit value of roughly $4,000, the total amount of
additional special education funding for this district would be $3.24
million.
Category A
500 Students
x 0.7
= 350
Category B
300 Students
x 0.7
= 210
Category C
150 Students
x 1.0
= 150
Category D
50 Students
x 2.0
= 100
Total Program Units
= 810
Program Unit Value
$4,000
Total Program Units
x 810
Total Special Education Allocation
$3,240,000

District Management Group | Helping Schools and Students Thrive | www.dmgroupK12.com
132
• Resource-based Formulas – States determine the needed resources (i.e.
staffing and materials) for a district using established staffing and
resource ratios. States will then make allocations to districts based on
their identified population of students with disabilities. Similar to the
various weighted models, states take a varied approach in determining
resource ratios, oftentimes incorporating the differing needs of disability
types and educational settings. Resource-based models take a similar
approach to the EB Model, linking resource allocation to research and best
practices for providing adequate special education services.
Tennessee funds special education through its Basic Education Program
(BEP) formula, which consists of 45 components that have been deemed
necessary for a school district to provide a basic level of education,
including special education. The total number of students with disabilities
in a district is used to determine its total resource allocation based on pre-
established resource requirements, shown below.
Resource
BEP Ratio
Teachers
10 options based on disability and severity,
ranging from
91.0 – 8.5 Students: 1 Teacher
Supervisors
750 Students: 1 Supervisor
Assessment
Personnel
600 Students: 1 Assessment Personnel
Assistants
60 Students: 1 Assistant
Materials
$36.50 per Student
Equipment
$17.25 per Student
Travel
$17.25 per Student
Tennessee uses the total number of students with disabilities in a district
and the various resource ratios to calculate a dollar amount, using an
average salary for the personnel positions. Regardless of the calculated
allocation, Tennessee will provide a base threshold of funding to districts
for special education.
Analysis:

District Management Group | Helping Schools and Students Thrive | www.dmgroupK12.com
133
The advantages and drawbacks of formula-based funding models ultimately
depend on the context of the state for which they were devised. Broadly, a
commendation for this type of model is that it attempts to calculate the
necessary resources for providing special education services by incorporating
an estimation of the per pupil excess cost of special education services. There is
a dearth of research, however, related to what constitutes an appropriate amount
of funding for special education, and even less research on how much is spent
on special education from all federal, state, and local governments. The broad
variation between states in multipliers, weights, and per pupil flat grants speak
to this lack of consistency.
In theory, formula-based models allow districts to receive resources
commensurate with the needs of the students they serve. Additional student
weights attempt to add more precision. In some cases, additional weights and
metrics can lead to funding models becoming byzantine, overcomplicating how
districts receive and ultimately utilize resources. Moreover, when improperly
devised, formula-based funding models can create distorted incentives for local
districts. For example, basing resources on the number of students identified for
special education could lead to the overidentification of students for disabilities,
since a financial incentive would exist for schools to use ambiguous
identification standards to place students into special programs. Many states
control for this challenge by capping the resources provided to a district based
on a specific proportion of students with disabilities, similar to Oregon’s
approach with resources limited to 11% of ADM.
Staff and leaders (as well as parents) often feel that the weights are too low, that
resources are limited, which in turn can lead to insufficient services provided.
That said, it also leads to a focus on developing cost-effective strategies and
reviewing costly approaches.
Because the weights are set by the state, this model, is easier for state leaders to
control state level funding for special education. It does not, however, actually
limit district level special education spending. Often districts cross subsidize
special education funding with general education/general purpose funding
from the state or local sources to cover any shortage. This pits special education
funding against general education funding. Often general education services
will be cut during economic down turns as a result.

District Management Group | Helping Schools and Students Thrive | www.dmgroupK12.com
134
What about advantages of the resource-based approaches; this provides a
standard set of resources based on the best practices described in this report
above, and which are incorporated into the Picus & Odden textbook approach
Comparison to Wyoming:
Formula-based approaches stand in contrast to the special education funding
model utilized by Wyoming, which is entirely based on reimbursement. Rather
than using complex formulas to determine a funding allocation, Wyoming opts
to reimburse allowable special education costs incurred by its districts and
schools. In that sense, Wyoming’s reimbursement model shares the goal of
formula-based models of funding districts in a manner proportionate to their
identified student needs. While Wyoming does not cap district allocations based
on special education identification rates, Wyoming Statute does require the
state superintendent to monitor identification rates and statewide spending is
capped.
B. Stipulated Appropriation:
Under this funding model, states will stipulate a specific funding appropriation
for special education programming based on a variety of factors ranging from
historical spending, projected need, or available funds. States will then disburse
funds to districts and schools through several types of mechanisms that follow a
similar pattern to formula-based models. The primary mechanisms used include
flat grants, needs-based calculations, and census block grants. Though similar to
formula-based models, stipulated appropriation models take a more top-down
approach to determining the total funding obligation for the state.
• Flat Grant & Needs-Based – In Colorado, the state appropriated over $195
million for special education services in Fiscal Year 2019-20. Resources
were then distributed to local districts using a needs-based calculation.
The Colorado Department of Education (CDE) provides a flat grant of
$1,250 for all students with disabilities, regardless of type. Then with the
remaining funds, CDE calculates an additional funding allocation for
students with more severe needs. This additional amount is capped at
$6,000 per student. The total allocation per district is the sum of these two
allocations. A simplified example is given below.
For a district with 1,000 students with disabilities, of whom 200 have
identified severe needs, the total allocation would be $2.45 million.

District Management Group | Helping Schools and Students Thrive | www.dmgroupK12.com
135
Base Funding Allocation
$1,250
Total Students with Disabilities
x 1,000
Core Special Education Allocation
$1,250,000
Additional Funding Allocation
$6,000
Students with Severe Disabilities
x 200
Total Additional Allocation
$1,200,000
Core Special Education Allocation
$1,250,000
Additional Allocation
+ $1,200,000
Total Special Education Allocation
$2,450,000
• Census Block Grants – Montana funds special education using a census-
based system, which assumes that a standard proportion of the student
population in a district will require special education services. The total
funding obligation for special education is distributed through the
following ratios:
Category
Ratio
Instructional Block Grant
52.5%
Related Services Block Grant
17.5%
Reimbursement of Local Districts
25%
Special Education Cooperatives and Joint
Boards for Administration and Travel
5%
The specific funding allocation for a district is calculated by taking the
district’s adjusted enrollment count, locally known as Average Number
Belonging (ANB). The state allocates $151.16 per student for special
education instruction and $50.38 per student for special education related
services. These allocations are based on the total ANB, not the specific
number of students with disabilities. Once district allocations are
determined, Montana requires its districts to raise $1 of local funds for
every $3 in state funds provided through the instructional and related
services block grants. If a district has allowable costs that exceed this
combined funding amount, the state will partially reimburse costs up to a
pre-established limit. Once this base allocation has been distributed, the

District Management Group | Helping Schools and Students Thrive | www.dmgroupK12.com
136
state will distribute the remainder of its obligated funds to specific
program-based allocations.
California and Vermont also use variations on census-based models,
which assume that a set percentage of students in each district will require
special education services. States use a district’s full enrollment count in
conjunction with a resource-based cost calculation to determine the
district’s special education funding allocation.
Additionally, in the EB model, Picus Odden & Associates recommend
incorporating the best practices outlined in this report into a census based
approach to special education funding for students with mild to moderate
disabilities.
Analysis:
One of the advantages of a stipulated appropriation model is that a state can
clearly manage the total cost of its special education services. While state
governments likely engage their constituents and use formulae to determine
the most appropriate funding amount, they are ultimately capping their total
funding obligation. Once the funding obligation is set, states utilize
mechanisms similar to formula-based models to ensure that resources are
provided to districts in an equitable fashion based roughly on level of student
needs.
It should be noted that limiting the state’s funding obligation can run the risk of
under-supporting special education programming. Many states, including
Montana and Colorado, will regularly conduct independent studies of the cost of
providing an ‘adequate’ education, inclusive of special education, to ensure that
their funding levels are appropriate. States will also augment their funding
models with opportunities for reimbursement in the event that a district or
school encounters a student with extraordinarily high needs.
Again, it’s important to note that while a state can limit what is provided for
special education spending a district cannot legally limit its special education
spending. In fact, IEP teams are precluded from making cost or availability of
funds a factor in their determination of what services to provide. When special
education spending exceeds the funding from state and federal sources local
dollars or general-purpose state dollars will be used.

District Management Group | Helping Schools and Students Thrive | www.dmgroupK12.com
137
In practical reality, three things tend to happen when available special education
dollars do not meet the full cost of providing special education services. 1)
general education services are reduced 2) IEP teams unconsciously set services
roughly in line with available funding and 3) more cost-effective practices
become the norm.
Comparison to Wyoming:
Wyoming’s reimbursement model is similar to the stipulated appropriation
model in that the state bases aggregate special education funding on historical
expenditures. This cap helps to control escalating costs in special education;
however, it does come with the risk of underfunding special education if
funding adequacy studies are not conducted and incorporated. The Wyoming
model differs from other stipulated appropriation models in its reimbursement
mechanism for disbursing funds. Rather than proactively allocating resources to
districts and schools, Wyoming reimburses based on a set of allowable
expenditures.
Inherent in these models is an assumed approach to staffing and service
delivery model. Since these formulas and assumptions tend to be complex, this
type of funding model does not often drive districts to a particular set of
practices but does tend to limit special education spending in aggregate. It
creates pressure to live within a set budget.
C. Cost Reimbursement:
Under a reimbursement model, as is used in Wyoming, states will reimburse
some percentage of the total special education costs in accordance with pre-
established allowable expenditures. Oftentimes, states will set a limit on the
total statewide funding obligation based on historical spending or some other
calculation. Reimbursement rates vary across the nation, from 26.79% of local
spending in Wisconsin to up to 100% of local spending in Wyoming. In many
cases, states will provide a contingency reimbursement fund in the event that a
student with extraordinarily high needs moves into a district.
• Partial-Reimbursement - Nebraska uses a typical partial-reimbursement
model for funding special education in which the state department of
education reimburses 57.5% of allowable costs associated with special
education programming. For example, if a district’s special education

District Management Group | Helping Schools and Students Thrive | www.dmgroupK12.com
138
costs totaled $2 million, the state would reimburse that district $1.15
million in the subsequent school year.
The state does not establish any aggregate statewide funding cap, nor
does it institute a cap on funding tied to the identification rate of students
with disabilities.
Analysis:
Reimbursement models are fairly straightforward in how they disburse
resources to districts in support of special education programming. The rate at
which a state will reimburse districts varies considerably between states, and
ultimately impacts the amount the local district would be responsible for
covering. One key assumption of reimbursement models is that special
education costs will remain relatively consistent from one year to the next. This
assumption is largely fair; however, it does disadvantage small districts in
which small changes in special education enrollment can have enormous impact
on the special education budget.
Comparison to Wyoming:
There are several considerations for Wyoming as it compares itself to similar
reimbursement models from other states. First, there is the question of the
percentage at which the state will reimburse districts. Wyoming’s commitment
to 100% reimbursement makes it one of the more generous models and not
surprisingly makes it popular among districts and schools. The lack of cost
sharing with districts does create the possibility of higher spending. This is
mitigated in Wyoming by the time-limited statewide cap and an inherent fiscal
stewardship by district leaders.
Wyoming does not currently utilize a contingency fund to support with districts
that experience extraordinarily high costs during a school year, which may
create challenges for districts that are asked to support students with severe
needs but may lack the resources in that school year.
D. Contingency or High Cost Reimbursement:
The other model for special education funding is a contingency or high-cost
reimbursement model in which states will cover up to 100% of the educational
costs for students with extraordinarily high or "excessive" costs, typically

District Management Group | Helping Schools and Students Thrive | www.dmgroupK12.com
139
designated as a certain percentage above the average per-student cost. Most
states use this model in conjunction with one of the other three models to
protect individual schools and districts from overly burdensome costs in a given
school year. Generally speaking, 1-3% of all students (10-15% of students with
disabilities) have more significant needs. Not all of these high needs students
might have needs that hit the high cost threshold. While outliers, a small
number of high needs students can cost over $100,000 a year to serve. In more
extreme, but no unheard-of cases, a single family can move into a district and
require $250,000 or more of services each year.
• High-cost & Single Student Weight - In Oregon, the state will provide
additional funding through a partial reimbursement model for students
with disabilities whose approved special education costs exceed $30,000.
This mechanism exists to ensure that districts are not unfairly
encumbered as students with less common, extreme needs emerge within
a district.
• High-cost & Census-based - Massachusetts will provide reimbursement
for highly cost-intensive students of up to 75% of special education costs
in excess of four times the state per-pupil foundation budget.
Massachusetts created additional conditions that must be satisfied in
order for a district to be able to access resources, noting that additional
funds are a part of an ‘extraordinary relief’ program that supports
districts whose special education expenses see at least a 25% annual
increase. Similarly, Vermont will reimburse districts for students with
costs exceeding $60,000 per fiscal year.
The EB model’s special education funding formula is based on a census-
based and high-cost model, with a census-based approach to funding for
students with mild to moderate disabilities, incorporating the best
practices outlined in this report, and a separation of the funding for high-
cost students with disabilities into a reimbursement model for these
students with costs that are harder to predict and manage.
• High-cost - Connecticut only provides reimbursement for its high-cost
students with disabilities, leaving the remainder of special education
funding to come from other sources. The state provides funding if the
costs for a student exceed 4.5 times the average per-pupil expenditure,

District Management Group | Helping Schools and Students Thrive | www.dmgroupK12.com
140
provided that available appropriations allow for the disbursement of
funds.
Analysis:
How a state integrates a high-cost or contingency funding model is largely
based on the context of its other funding mechanisms. In general, contingency
funding models are an appropriate method to address the uneven distribution
of high-need students across districts. In some situations, extraordinarily high
costs can place districts in financial risk if they are not prepared to support such
students. Contingency funding models are a relatively fair method in dispersing
the inordinate costs of high-need students across a state. Funding is not
unlimited however, and many states will impose restrictions on how much they
will reimburse either by setting specific caps or creating an application process
so that the state department of education can methodically distribute resources
to districts in need.
Considerations for Wyoming:
Wyoming does not currently utilize a high-cost contingency funding model. Its
100% reimbursement model in theory covers these added costs, but there is a
delay for districts in accessing those resources, as reimbursements are
distributed based on the previous year’s expenditures. Some version of a
contingency fund could support Wyoming districts in real time, as new
extraordinarily high cost students are enrolled.
The availability of reserve funds at the district level also impacts the need for
real time support of high need/high cost students. If districts have sizable
reserves, they are better able to carry the costs until reimbursement comes in
future years.

District Management Group | Helping Schools and Students Thrive | www.dmgroupK12.com
141
3c. Recommendations for the Wyoming Funding Model
Wyoming’s current reimbursement model for funding special education meets
many of its intended goals, and many of the potential drawbacks have been
avoided such as rapidly increased spending and over identification. However, the
model has reduced pressure on districts to assess and innovate how they serve
students with special needs. This has unintentionally encouraged a number of
low impact but high cost practices to become common practices. Students, staff
and the budget would all benefit from a system that encourages wider adoption
of best practices. This can be done with minor adjustments to the current funding
model coupled with sharing of best practices, technical assistance and nudges to
adopt best practices. It is important to note that changes to funding must move in
concert with changes in practice, but not faster than changes in practice.
Looking to the future, the state may wish to protect against spending practices
that haven't been evident to date but might arise if overall district budgets get
tight.
Recommendation #1. Place greater emphasis on how dollars are spent rather
than just how much funding is provided to special education.
Under the current Wyoming reimbursement model, little emphasis is placed on
how dollars are used to develop highly effective special education
programming. Provided that expenditures satisfy a preapproved set of special
education related costs; little guidance is given to schools and local education
agencies on how to ensure expenditures are evidence-based and driving towards
improved results for students. This phenomenon ultimately leads to several of
the challenges identified in the earlier portion of this review related to
Wyoming’s funding model including having a high statewide average for per
pupil costs as well as a lack of incentives nudging districts towards funding
special education best practices.
While it is not the recommendation of this report that the state abandons its
reimbursement model, Wyoming might consider providing greater structure
and guidance for how dollars are being expended, similar to the EB model. A
greater use of targeted funding for instructional coaches, interventionists and
high-quality tutors is one such nudge towards cost effective best practices. In
fact, by fully funding Tier 1 and Tier 2 supports in the EB model, Wyoming
would be nudging districts towards an improved and more cost-effective special

District Management Group | Helping Schools and Students Thrive | www.dmgroupK12.com
142
education system. Fully implementing the EB model would allow resources to be
shifted from special education reimbursements. While districts and the state
must carefully navigate the Maintenance of Fiscal Support (state requirement)
and Maintenance of Effort (local district requirement) or Supplement not
Supplant provisions, the U.S. Department of Ed encourages such shifts and
current Maintenance of Effort flexibilities would allow a gradual shift in
spending.
Additional guidance on special education reimbursements could include
ensuring all special education expenditures are aligned with educational best
practices, discouraging the use of common, but ineffective supports, and
encouraging the braiding of funds with other funding sources to create high-
quality and integrated special education programing.
By shifting emphasis away from total amount expended to how funds are
expended, the state would be encouraging an improved deployment of
resources. Such changes would ultimately make special education programming
more cost effective and less costly while at the same time increasing student
achievement.
Why aren't best practices already being widely adopted?
When districts across the state embrace practices such as co-teaching,
paraprofessionals for academic support, and very small groups, it's not because
the reimbursement model allowed for these high cost practices. All three of
these practices are utilized in Wyoming because there is the belief that they are
the best practices to help students achieve. In fact these practices become
common place across the country, including states that have much less generous
funding models, including models with very tight caps on funding. Districts
utilized these strategies because they want to help kids achieve at high levels.
For many years common wisdom was that these were "best practices". Because
achievement was low for students with disabilities, there was pressure to add
more of these services.
In states that have funding models that create fiscal pressure on districts, the
districts were quicker to assess the impact of these presumed best practices, to
consult gold standard research such as John Hattie and the What works Clearing
House, and more quickly change from past practice to best practice.

District Management Group | Helping Schools and Students Thrive | www.dmgroupK12.com
143
If more districts in Wyoming understand and accept research based best
practices, they are likely to adopt them, which will increase learning and reduce
costs.
Recommendation #2. Consider encouraging the use of general education staff to
support students with disabilities through the reimbursement model.
Students and budgets would be well served if students with special needs
received more services from general education teachers as well as special
education staff. While it is prudent that the 100% reimbursement model apply
only to services for students with special needs, there need not be a requirement
that these incremental services are provided by staff with special education
certification, if a general education teacher or interventionist is well qualified to
provide them.
Consider the case of an elementary school that is designing an intervention
program for its students who struggle to read. Under the current interpretation
of the Wyoming funding model, a school might develop two parallel reading
intervention programs for struggling students, one for students with identified
disabilities and another for students who struggle, but who do not have an
identified disability. Despite having similar needs these student groups would
likely be served in separate programs due to a district or school’s belief that
special education funding can only reimburse costs within the special education
department. Students with disabilities might be further dis-serviced, for the
school would likely assign a special education teacher or paraprofessional to
provide the service, rather than an interventionist specifically trained in reading
and early literacy. Special education staff provide important supports to
students with disabilities; however, their broad range of responsibilities often
make their providing specific interventions, such as in literacy, a challenge.
Some special educators are very well trained and skilled at providing
intervention, but not all. Far fewer paraprofessionals are highly skilled
interventionists and teachers of reading.
To encourage a more effective deployment of staff and resources for special
education programming, the state might consider offering specific guidance for
how districts and schools can share staff and programs between special
education and general education. Two example methods for determining the
share of costs are given below.

District Management Group | Helping Schools and Students Thrive | www.dmgroupK12.com
144
Per Pupil Allocation – Districts could apportion the costs of a general education
instructor who is providing intervention supports to students with disabilities
by taking the proportion of students with disabilities from the total number of
students served by that teacher.
Ex. For a reading interventionist with general education certifications who
supports 40 students, 15 in special education 25 in general education, the district
could cover 37.5% of their salary and benefits with special education resources,
covering the remaining costs with other funding sources.
Students Served
No.
Pct.
Students in Special Education
15
37.5%
Students in General Education
25
62.5%
Total Students
40
100%
Time Allocation – Districts could alternatively share the costs of an instructor
by recording how that individual spends their time serving specific student
groups and splitting costs accordingly.
Ex. Consider a high school math teacher who teaches one section of intervention
math for students with disabilities. Assuming this teacher has five course
sections in total, 20% of their time would be devoted to special education
services. The district could therefore cover 20% of this teacher’s salary and
benefits with special education resources.
Courses Provided
No.
Pct.
General Education
4
80%
Special Education
1
20%
Total Courses
5
100%
In a siloed funding model, the district might have staffed this math intervention
with a special education teacher, who despite having full credentials in special
education, often would not have the necessary background to provide strong
intervention in secondary math. In contrast, the above example shows how
districts can adjust their approach to funding to ensure that students with
disabilities are given access to the same high-quality, content-strong teachers
and interventionists who are provided for students in the general population.
Over time, there is a significant opportunity to shift resources from special
education to general education, eventually reducing the special education

District Management Group | Helping Schools and Students Thrive | www.dmgroupK12.com
145
spending. This must be done slowly and deliberately to maintain compliance
with Maintenance of Effort requirements and to give districts time to adjust their
practices. (see Appendix F).
Recommendation #3. Consider establishing checks and balance to limit the
financial incentive of over-identification of students with disabilities.
As noted in the commendations, districts in the state do not over identify
students with disabilities. If, however, school budgets get tighter in the future
there is an incentive to unconsciously begin to overidentify students with
disabilities. It is important to consider that while many nationally normed
assessments are used to determine if a student has a disability, there is actually
great latitude and personal judgement in making the determination. In fact,
some districts and states identify twice as many students as others, even if they
have nearly identical students.
While Wyoming currently monitors the percentage of students in a district who
are identified for special education, the state might consider setting checks or
funding limitations that are tied to the proportion of students with disabilities
in a district. A financial incentive could exist for a district to over-identify
students for special education services to increase their total resources. While
not currently reported in Wyoming, this trend has been reported in other states
with similar funding models. Though motives for identifying students may be
good, inappropriately identifying a student for special education can lead to
extremely negative outcomes for that child over the long term. Any reduction in
general education funding could make this challenge more likely.
Wyoming might consider monitoring the allocations that are distributed to
school districts in the context of their special education identification rates. Any
district above the given threshold for identification would trigger a review by
the department of education to ensure that resources are being utilized
effectively and that students are being identified and placed appropriately. This
check would prevent the reimbursement model from creating a financial
incentive to over-identify students for special education, while still allowing for
increased spending when appropriate and necessary.
Recommendation #4. Separate high need, high cost students into their own
reimbursement plan with a different cap and process for more timely
reimbursement.

District Management Group | Helping Schools and Students Thrive | www.dmgroupK12.com
146
On average, a small proportion of students with disabilities, somewhere between
1 and 3% of all students, have more significant needs. While not all students with
high needs require intensive and high cost support, there are instances where a
single student’s moving into a district can require added costs of $35,000 to
upwards of $250,000. Such added costs can create challenges for districts,
especially in the first year.
These students, defined often as “Level 4” or “high cost, high need” are separated
out in many other models of special education funding. Other states define
these students by a few different metrics:
Above a specific dollar amount: students with needs that cost above a specified
amount. For example, students with needs that cost more than $30,000.
• In Vermont, high cost students are defined as students with needs that
exceed $50,000.
• In West Virginia, high cost students are defined as students with needs
that exceed $33,824.
• In Wisconsin, high cost students are defined as students with needs that
exceed $30,000.
Above a set proportion or ratio: students with needs that cost above a specified
proportion of per pupil spending. For example, students with needs that cost
greater than four times the base per pupil allocation.
• In Connecticut, high cost students are defined as student with needs that
exceed 4.5 times the average per-pupil expenditure.
• In Massachusetts, high cost students are defined as students with needs
that exceed four times the average foundational budget.
• In New Hampshire, high cost students are defined as students with needs
that exceed ten times the state average expenditure.
• In Rhode Island, high cost students are defined as students with needs
that exceed five times the core foundational amount.
By specific disability: students with specific disabilities are defined as high
need, high cost. This is typically associated with multiple student weight
funding models. For example, students with Orthopedic Impairments receive
six times the base allocation and students with Multiple Disabilities Severe
Sensory Impairment receive seven times the base allocation.

District Management Group | Helping Schools and Students Thrive | www.dmgroupK12.com
147
• In Florida and Arizona, students with specific disabilities receive higher
funding based on their disability.
In Wyoming, in the current reimbursement model, high cost supports for a
small number of students with high needs may obscure or distort how the
remaining funds are used to provide programming for students with mild to
moderate needs. For example, a district that has quickly increasing special
education costs may attribute all the increase to a handful of new high needs
students. If that is the case, then the district has been a good steward of funds. If
half the increase, however, was driven by expanding low impact services for
students with mild to moderate disabilities, then they have not been as prudent
a steward. Current funding and reporting systems make it difficult to determine
which is the case.
Moreover, the great variability in district level spending for these students
makes it hard for district leaders to either embrace more broad efforts to
manage special education spending or to accept a cap as fair and reasonable. It is
easier for districts to manage special education spending for students without
severe needs.
Wyoming might consider separating out the costs associated for students with
high needs from their reimbursement model, creating instead a separate
contingency fund for such high-needs students. As outlined above, the state
could set a threshold amount (typically between $30,000 and $50,000) or
identify a set of disabilities that would qualify a student’s costs as being eligible
for reimbursement through the contingency fund. This would allow districts
and the state to more closely monitor and manage the remaining special
education spending. Since disability categories are not cleanly defined in
practice, the dollar threshold is likely a better measure.
The separate funding mechanism for students with high need disabilities could
readily be called on to reimburse high costs above that preidentified threshold.
Beyond deploying necessary funding for programming in a timelier fashion,
separating resources for high cost students into a separate fund would help the
state monitor more clearly how its resources are being distributed across
districts, schools, and programs. Creating a high cost contingency fund is
consistent with the approach taken by over 14 states as well as many others that
use separate funding weights for more resource intensive disabilities.

District Management Group | Helping Schools and Students Thrive | www.dmgroupK12.com
148
This approach would also allow the state in the future to more accurately
forecast what is a reasonable level of spending for students with mild to
moderate special needs by a district using an EB model approach similar to
general education spending.
If the state set a high needs cap, it could also, in time set a separate cap for mild
to moderate needs as well. Setting the mild to moderate needs cap is an involved
process and shouldn’t be done lightly or quickly. Students and taxpayers would
only benefit if the cap is paired with support for districts to change their
practices. If districts adopted the changes in practice outlined in this report, the
mild to moderate needs cap could be lower than current spending and students
would be better served. If the cap is set lower than current spending without
associated changes in teaching and learning practices, students would likely be
worse off. While many of the changes are common sense, they are not common
practice and reflect a high level of change for many districts in the state. Time
and support will be required to help facilitate the shift in practice, staffing and
IEPs. Making specific recommendations on the details of a mild to moderate cap
go beyond the scope of this contract, but could be provided in the future.
Recommendation #5. Consider establishing greater checks & balances for costs
associated with non-high needs students in the reimbursement model.
With the separate contingency fund for students with extraordinarily high
needs, programming for students with mild to moderate disabilities can be
monitored with greater clarity. In general, the needs of students with mild to
moderate disabilities are more predictable, more aligned to total enrollment and
more within the control of individual districts. Wyoming might consider
strengthening its system of checks and balances on special education funding
for students with mild to moderate special needs. A number of potential checks
and balances are provided for consideration. With implementing any of these
checks and balances, Maintenance of Effort is an important requirement to be
conscious of. There is however an opportunity over time to reduce special
education spending and maintain compliance with Maintenance of Effort
requirements. For more information on this, see Appendix K on Maintenance of
Effort.
A). A system of checks and balances might be as simple as maintaining
100% reimbursement but also calculating “reasonable" levels of spending
per district for students with mild to moderate special needs. This would

District Management Group | Helping Schools and Students Thrive | www.dmgroupK12.com
149
provide a guidepost for districts, who sincerely wish to be good financial
stewards and an indication to the state if spending in a district should be
reviewed.
Such a target would create incentives for districts to seek cost effective
strategies for providing services, while still giving districts and schools
the necessary flexibility to write IEPs and meet the individual needs of
students.
Wyoming might consider using a census or resource-based model to
estimate what is reasonable spending for mild to moderate special
education funding. These cost estimates would be based on best practice
supports and staffing configurations.
B). The state might additionally pursue regular reviews of the key drivers
of special education costs, ensuring that expenditures remain consistent
with best practice. Included with such reviews would be regular special
education staff caseload benchmarking to state and nationwide averages,
especially examining the role and staffing of paraprofessionals, ensuring
that caseloads remain within an appropriate range.
C). The state might also consider conducting academic return on
investment analyses on its highest cost and potentially highest impact
programs to ensure that all programs are yielding the best possible
results.
D). The state could utilize the calculation for reasonable levels of spending
for students with mild to moderate special needs in establishing the mild
to moderate needs statewide cap. This would bring special education
funding more in line with how general education funding is determined,
while also providing districts protection from hard to plan for high needs
students.
Wyoming might consider setting the cap for special education spending
for students with mild to moderate special needs based on a census-based,
EB model to determine a practical and sufficient level of spending
statewide, while also taking into account past spending trends. However,
this cap would only be sufficient if other elements of the EB model are
fully funded, including instructional coaches, interventionists, and
general education supports. Any reduction in the statewide cap would

District Management Group | Helping Schools and Students Thrive | www.dmgroupK12.com
150
need to be made slowly and deliberately in pace with districts changing
how they serve students with mild to moderate disabilities, to ensure
compliance with Maintenance of Effort (see Appendix K) and to ensure
services are not reduced for students. Any cap should take into account
both inflation and desired shifting of practice.
An enhanced system of checks and balances would ensure a cost-effective
statewide special education system that encourages delivering the highest
quality services to students with disabilities.

District Management Group | Helping Schools and Students Thrive | www.dmgroupK12.com
151
4. Reviewing Special Education Guidance and Practice
Introduction - IDEA State Level Policy & Practice
The federal government sets the rules under which special education operates
and is funded, but states can add to these requirements, and often do, through
their own state guidance. State guidance frequently shapes how the federal rules
are interpreted and implemented on the local level. To understand Wyoming’s
interpretation and implementation of federal IDEA, Part B’s spending (the
primary source of federal special education funds) and related fiscal rules,
DMGroup engaged and consulted with Federal Education Group (FEG). FEG is a
law and consulting firm that helps states, school districts, and other educational
organizations understand federal law. FEG’s co-founders Melissa Junge and
Sheara Krvaric are published national leaders in the topic of federal education
law, and have helped numerous states and districts understand, interpret, and
implement federal law, including IDEA.
FEG conducted an in-depth review of the existing WDE IDEA, Part B guidance
and practice with two primary goals in mind: understanding 1) the extent to
which the state's guidance materials are consistent with federal spending and
fiscal requirements and 2) the extent to which materials reflect available federal
flexibilities and support cost effective best practices. Their full report is included
in Appendix F.
IDEA, Part B funds are additional, separate funds provided to districts to support
students with disabilities. These funds are separate from the state
reimbursement funds to districts. Districts submit expenditure reports both for
IDEA, Part B expenditures and state reimbursement expenditures. The 100%
reimbursement model excludes expenditures funded through IDEA, Part B, thus
no expense if funded by both sources.
District Management Group | Helping Schools and Students Thrive | www.dmgroupK12.com
152
4a. Review of Wyoming Guidance for Implementation of IDEA, Part B
In general, WDE adheres to federal requirements related to educating students
with disabilities by prioritizing the provision of services in the least restrictive
environment possible. The state agency also understands the broad array of
allowable expenditures for IDEA, Part B funds.
In the words of the U.S. Department of Education, “IDEA, Part B funds can be
used for a wide variety of strategies to improve student outcomes.”
38
These
funds are governed by three fiscal rules, each of which is intended to ensure that
districts or Local Education Agencies (LEAs) use their allocated funds to expand
services for students with disabilities rather than replace the state and local
money that they would otherwise spend to support such students.
An overview of the three fiscal rules is given below:
1. Maintenance of effort (MOE), which requires LEAs to budget and spend at
least as much local (or state and local) money on special education as they
did the year before,
2. Excess cost, which requires LEAs to spend, on average, the same amount
of non-IDEA money on children with disabilities as they spend on
children in the LEA as a whole,
3. Supplement, not supplant, which prohibits LEAs from using IDEA, Part B
funds to replace the state, local, and other federal funds they would
otherwise spend on special education if they did not participate in IDEA.
Despite the clear understanding at the state level regarding the allowable uses of
IDEA funds, there are misunderstandings at the local level, which inadvertently
create more restrictive, less cost effective and less effective learning experiences
for students.
38
U.S. Department of Education, Non-Regulatory Guidance on Using ARRA Funds Provided Through Part B of the
Individuals with Disabilities Education Act (IDEA) to Drive School Reform and Improvement, (2009), p. 4,
available at https://www2.ed.gov/policy/gen/leg/recovery/guidance/idea-b-reform.pdf. Please note ED
developed this guidance to help districts spend the additional IDEA, Part B funds appropriated through the
American Recovery and Reinvestment Act, but it applies to regular IDEA, Part B funds as well. The
guidance will be referred to as 2009 IDEA Reform Guidance from now on.

District Management Group | Helping Schools and Students Thrive | www.dmgroupK12.com
153
These misunderstandings perhaps stem from WDE guidance on two fiscal rules
in IDEA, Part B: 1) excess cost, and 2) supplement, not supplant. WDE guidance
on these two rules seem to add restrictions to specific kinds of spending for
special education programming that do not exist in federal law. While WDE’s
guidance is not necessarily incorrect and did not intend to restrict spending
uses, it allows for an interpretation of IDEA, Part B that narrows the allowable
uses of funds for districts, making it more challenging for district and school
leaders to design high-quality supports for their students with disabilities in an
efficient and effective manner. With this, all available federal dollars are
currently received and utilized, but their impact may not be maximized.
Broadly, WDE guidance allows for an interpretation of IDEA, Part B fiscal rules
that reduces the impact of federal dollars by restricting or discouraging the use
of various best practice supports. Specifically, Wyoming guidance appears to
many in the field to prohibit districts and LEAs from using IDEA, Part B funds
on services that may also be provided to students without disabilities. Though
seemingly innocuous, this guidance minimizes the impact of federal dollars and
prevents school districts from developing effective and cost-effective supports
and interventions for students with disabilities that are integrated with general
education materials, services and staff.
Wyoming guidance on the excess cost and supplement, not supplant rules for
IDEA, Part B creates additional provisions for districts and LEAs to conduct fiscal
checks that go above and beyond federal requirements on the services provided
by these dollars. Specifically, Wyoming guidance assesses excess costs at the
individual expense line item level rather than in the aggregate, and outlines
criteria for determining excess costs through a set of questions on each specific
expense.
In particular, WDE uses an excess cost verification manual that describes three
criteria that each cost supported with IDEA, Part B funds must satisfy to be
considered an excess cost. The three criteria are given below:
When determining whether an expenditure is an excess cost, consider these guiding
questions:
1. In the absence of special education and related services, would this cost
exist?
If the answer is…
• No – it is an excess cost.
District Management Group | Helping Schools and Students Thrive | www.dmgroupK12.com
154
• Yes – it is not considered an excess cost and is not allowed.
2. Is this expenditure also generated by students without disabilities?
If the answer is…
• No – then the expenditure is an excess cost.
• Yes – then the expenditure is not an excess cost and is not
allowed.
3. If it is a child specific service, is the service documented in the student’s
IEP?
If the answer is…
• Yes – then the expenditure is an excess cost.
• No – then the expenditure is not an excess cost and is not
allowed.
39
These three criteria do not come from federal law or guidance but are a common
misperception of how to test for excess cost compliance. The criteria do not
satisfy IDEA, Part B excess cost requirements and restrict IDEA Part, B spending
and service options.
Similarly, WDE guidance requires districts to test if individual expenses meet
supplement, not supplant requirements through two presumptions about each
expense, meaning there are two situations in which WDE will presume
supplanting occurred:
1. If an LEA uses IDEA, Part B funds to provide services it is required to make
available under other federal, State, or local laws or policy.
2. If an LEA uses IDEA, Part B funds to provide services for students with
disabilities that the LEA also provides for non-disabled students.
According to the U.S. Department of Education however, determining
compliance with both excess cost and supplement, not supplant does not require
looking at individual expenses, but rather just the aggregate IDEA, Part B
39
See, for example, Wyoming Department of Education, Reference Guide: LEA Spending of IDEA Funds,
available at https://1ddlxtt2jowkvs672myo6z14-wpengine.netdna-ssl.com/wordpress/wp-
content/uploads/2015/11/Guidance-re.-LEA-Spending-of-IDEA-Funds.pdf.

District Management Group | Helping Schools and Students Thrive | www.dmgroupK12.com
155
spending, which allows for a more holistic approach to special education
programming.
WDE’s guidance on IDEA, Part B spending creates pressure for districts and LEAs
to separate or silo special education services, materials, and staff from general
education. While not the intent of WDE, this separation may reduce the impact
of federal funds and inadvertently shape special education programming such
that the system is made more siloed and complex and the quality of services for
students is diminished. Guidance that functionally creates silos between special
education and general education programs inherently restricts collaboration
and alignment between programs and staff and can have the undesired effect of
undermining effective inclusion and reducing education best practices, which
embrace a more active and integrated role for general education staff, materials
and curriculum.
Below are three examples that highlight how a district’s limited understanding
of the law could create less effective programming for students with disabilities.
Ex. 1 –
Consider a district that wants to build a strong reading intervention
program for their students with disabilities who have identified needs for
literacy supports. Based on their understanding of Wyoming’s guidance
on IDEA, Part B funds, this district might restrict its hiring to only staff
who have special education certifications and work exclusively with
students with disabilities. Rather than hiring a content-expert reading
teacher, trained to provide literacy interventions for all students, the
district might instead hire a special education teacher, or if none were
available as there is a shortage of special education teachers in Wyoming,
a paraprofessional aide.
While special education staff are knowledgeable in special education and
provide invaluable services to students, they often do not have the specific
content training needed to provide targeted instruction and interventions.
In sum, rather than hiring a literacy content expert, this district likely
would hire a special education teacher or paraprofessional with limited
experience or knowledge of literacy to support their students with
disabilities, all because of their misinterpretation of the allowable uses of
IDEA, Part B funds.

District Management Group | Helping Schools and Students Thrive | www.dmgroupK12.com
156
Ex. 2 –
Consider a district that plans to use its IDEA, Part B funds on professional
development on various strategies to support students with mild to
moderate disabilities. Based on district understanding of Wyoming’s
IDEA, Part B guidance, districts may limit this training to special
education staff, which would reduce its reach and impact. General
education staff who also work with students with disabilities and would
stand to benefit from such a training might be prevented from attending
because they are not considered special education staff.
Ex. 3 –
Consider a school that wants to use IDEA, Part B funds to purchase
technology or materials, perhaps a secondary math intervention program.
Wyoming’s guidance on IDEA, Part B funds could inadvertently lead this
school to restrict the new technology to students with disabilities, even
though it may be effective for all students. Moreover, the school would
likely create a separate set of interventions or supports for students who
struggle but do not have identified disabilities. This approach would
create duplicative work for staff and may create an additional challenge
for students with disabilities who might receive competing strategies or
supports in their general and special education settings. Because of
perceived funding restrictions, the school would be in effect creating a
separate program for students with disabilities rather than leveraging
resources to create the strongest supports possible for all students.
Attempting to provide intentional supports for students with disabilities,
the school might inadvertently create less effective programming.
Federal law permits school districts and LEAs to spend IDEA, Part B funds on a
broader range of activities than is reflected in the Wyoming’s guidance. In fact,
the U.S. Department of Education encourages districts to use IDEA, Part B funds
on initiatives that meet the needs of all students, both students with and without
disabilities, provided that IDEA, Part B funds are blended appropriately with
other funding sources. Such approaches to special education programming lead
to improved outcomes for all students both with and without disabilities.

District Management Group | Helping Schools and Students Thrive | www.dmgroupK12.com
157
4b. Recommendations:
Recommendation #1. Revise state guidance on IDEA, Part B excess cost and
supplement not supplant requirements to reflect the full flexibility intended by
the federal regulations.
The state should revise their excess costs and supplement not, supplant
guidance to encourage school districts to use the same effective services for
students with and without disabilities. In particular, Wyoming should consider
eliminating the three guiding questions as criteria for determining excess costs
and the two presumptions of supplanting. By eliminating these provisions,
more effective services can be provided to more students, as these funds can be
used to purchase professional development, materials, and staff that can impact
students with and without disabilities, maximizing the effectiveness and
efficiency of these funds.
Given how deeply many district leaders hold as truth their overly restrictive
understanding of allowable uses, WDE will need to regularly, forcefully and
clearly communicate the change in understanding and behavior they wish to
encourage for use if IDEA part B funds.
Recommendation #2. Update State monitoring tools to reflect the new
guidance.
Currently, Wyoming uses a consolidated grant monitoring process to oversee
local compliance with several U.S. Department of Education grant programs
including IDEA, Part B. If the state updates its excess cost, supplement, not
supplant and spending guidance, as suggested above, it would need to update its
monitoring system as well.

District Management Group | Helping Schools and Students Thrive | www.dmgroupK12.com
158
5. Conclusion & Next Steps
The opportunities and recommendations identified in this report are intended
to raise achievement for students with disabilities, to make the work easier for
staff, and to do both of these in a cost-effective manner. This information can
help facilitate discussions and guide the direction for WDE and the Legislature
as they make decisions on any changes or updates to guidance and funding for
school districts.
Overall, DMGroup’s findings for Wyoming special education can be summarized
as follows:
Academic Achievement
● To raise achievement for students with special needs, changing how
dollars are spent will be more important than focusing how many dollars
are spent.
● To improve outcomes for students with disabilities, improving general
education core instruction, general education provided intervention, and
classroom based social-emotional practices are key. General education
and effective inclusion are more than half the solution.
Spending and Funding
● These practices – core instruction, extra help for struggling students and
social/emotional supports – are fully funded in the EB model, can be
provided before a student is identified as having a disability, and are more
cost-effective than current approaches to providing special education
services.
● The additional spending for students with disabilities is higher in
Wyoming than the national average, both in absolute terms and in
comparison to general education spending. This higher spending has not
led to higher levels of achievement. The higher spending is driven both by
factors that contribute to higher general education spending: the small,
rural nature of many districts and higher than national average staff
salaries, and by an embrace of some high cost, but less effective strategies.
● Overall, Wyoming’s reimbursement model for special education is
ensuring students with disabilities receive the services schools and

District Management Group | Helping Schools and Students Thrive | www.dmgroupK12.com
159
districts believe are appropriate. Despite incentives that could increase the
number of students identified for a disability and the possibility of rapid
increases in spending year over year, district leaders have balanced the
needs of students with fiscal responsibility, based on their understanding
of best practices. However, updates to this model can ensure that most
dollars are used for best practices and in a cost-effective manner. This
would raise achievement and reduce costs over time.
● There is a misunderstanding concerning the acceptable uses of
Individuals with Disabilities Act (IDEA), Part B dollars that may
unintentionally discourage cost effective best practices for serving
students with disabilities.
Small District Challenges
● Small, rural schools and districts face unique challenges to serving
students with special needs and would benefit from creating regional
approaches to these challenges which could both provide better services
for students and at a lower cost.
● Improving the recruitment, retention, and training of special educators as
well as content expert teachers with special education training will help
schools and districts improve services and reduce the long-term costs. The
national shortage of special educators has led to an over reliance on
paraprofessionals, which is not optimal for students or the budget. This is
true in all districts, but more acute in small districts.
There is a practical and proven path to better outcomes at more moderate costs,
but much conversation and planning is still required through a structured and
inclusive process. Not all consideration discussed in this report can be addressed
at once. If the state chooses to pursue any of these areas further, it will typically
take a year or two of careful planning, research, communication, coordination,
and roll-out to successfully make changes for districts, schools, staff, and
students.
Over the next several months, the legislature and WDE leaders should consider
the changes they would like to see in practice and establish short and long term
measurable goals and action steps to make any desired changes.

District Management Group | Helping Schools and Students Thrive | www.dmgroupK12.com
160
Given that current practices have been in place for decades and widely
embraced, it is likely that an independent, trusted third party will be helpful to
facilitate changes that will benefit students, staff and the budget. Key steps
include:
• Sharing the findings and best practices broadly across the state
• Creating safe spaces for candid discussion of best practices and current
practices
• Identifying levels in guidance, support, and funding that will accelerate
adoption of cost-effective best practices.
• Providing direct technical assistance to interested pilot districts to work
closely with teachers, administrators, and parents to revise services,
staffing patterns, schedules and services.
• Create expanded regional services either through existing or new entities.
• Develop clear and practical strategies to address the special education
teacher shortage.
A modest investment in planning and implementation can drive significant
gains for students and staff and reduce costs.

District Management Group | Helping Schools and Students Thrive | www.dmgroupK12.com
161
6. Appendices
6a. Appendix A - DMGroup Sample Interview Questions
State Leaders:
Special Education Funding & Spending:
1. Give me some background about how special education funds are
currently allocated in the state.
2. Tell me about the history of how special education funding has changed.
3. What are the strengths of this system?
4. What are the challenges you see to this system?
5. Would you change the reimbursement system? Why or why not?
6. In your view, how efficient is Wyoming’s spending on special education?
Why?
7. In what areas do you believe that there is overspending in Wyoming?
Why?
Special Education Services:
1. Stepping back from spending, what is working well with special education
in the state?
2. What frustrates you about special education in the state?
3. What could the state do to raise the student achievement of students with
special needs?
4. What are the greatest areas of consistency in special education across the
state? Inconsistency?
a) How likely is it that a given student would get the same IEP if tested
in each school in the district?
5. Do you think there is a problem of over-identification in the state? Why?
6. Does the state do a good job of inclusion?
7. Are there guidelines provided by the state on special education staffing or
services for districts? If so, what are these?

District Management Group | Helping Schools and Students Thrive | www.dmgroupK12.com
162
8. Are there areas that you think we’re going to find special education
services are better or worse across the state (e.g. districts, locations, service
models, supports for specific disabilities)?
9. When you envision a future state of special education for the state, what
are the changes you’d like to see?
10. If you could change one thing in the state to better serve students with
disabilities, what would you do?
District Leaders:
1. What is working well in terms of special education in the district?
2. What are the greatest challenges your district has been facing over the last
few years when it comes to special education?
3. What frustrates you regarding special education in the district?
4. What are some things the district could do to raise the student
achievement of students with disabilities?
5. What are some things the state could do to raise the achievement of
students with disabilities?
6. What are the supports available to students with disabilities in your
district? How is it determined which students receive which supports?
7. What is the process in which you receive funding for students with IEPs
from the state?
8. How do you use IDEA, Part B funds and how is this different from 401
funds?
9. What works best about the reimbursement system from your perspective?
10. What are the challenges with the reimbursement system?
11. How do you allocate staff and dollars to schools, especially in regard to
students with disabilities?
School Practitioners:
1. What is working well with special education in the district (academically
and behaviorally)?
2. What frustrates you about special education in the district?
3. What is your role in providing supports to students with IEPs? What is our
role in providing supports to students without IEPs?

District Management Group | Helping Schools and Students Thrive | www.dmgroupK12.com
163
4. What is the main service delivery model you use (co-teaching, pull-out.
Push, in, etc.)?
a) Is this approach working? How do you know?
b) What subjects do you teach?
5. In what ways do general education and special education teachers to align
instructional and behavioral needs of students?
6. What is the role of a paraprofessional in your school? How effective is
this?
7. Walk me through the supports available for a student with an IEP with
academic goals.
8. Walk me through the supports available for a student with an IEP with
behavioral goals.
9. If I’m a 3rd grader in your class struggling to read, what is the process you
would follow to getting me additional supports?
10. What supports are available for students with an IEP?
11. What supports are available for students without an IEP?
12. If you had a magic wand and could change one thing in your district to
improve special education services, what would you change? Why?

District Management Group | Helping Schools and Students Thrive | www.dmgroupK12.com
164
6b. Appendix B – DMGroup Schedule of Meetings with WDE, LSO and
Wyoming K-12 Education Associations
January 22, 2020
8:00 AM Introduction and Organization; LSO, Picus Odden & Associates,
District Leadership Solutions and District Management Group
9:00 AM Jillian Balow, Superintendent of Public Instruction
11:00 AM WDE’s Continued Review of Educational Resources in Wyoming
Report
Trent Carroll, Chief Operations Officer, WDE
Kim Morrow, Director of Finance, WDE
Leslie Zimmerschied, School Foundation Program Supervisor, WDE
1:00 PM Wyoming Association of Special Education Administrators
Dallas Myers, Fremont County School District #25 (by telephone)
JP Denning, Laramie County School District #1
Steve Slyman, Albany County School District #1

District Management Group | Helping Schools and Students Thrive | www.dmgroupK12.com
165
January 23, 2020
8:00 AM WDE Special Education Programs
Trent Carroll, Chief Operations Officer, WDE
Kim Morrow, Director of Finance, WDE
Leslie Zimmerschied, School Foundation Program Supervisor, WDE
Shelley Hamel, Chief Academic Officer, WDE
Margee Robertson, Division Director of Special Education Programs,
WDE
Deb Montoya, Federal Budget Analyst, WDE
Susan Shipley, Continuous Improvement Supervisor, WDE
Jennifer Krause, Supervisor – General Supervision, WDE
3:15 PM Wyoming School Boards Association (via Zoom)
Brian Farmer, Executive Director
Ken Decaria, Government Relations Director
Greg Borcher, President (Park County School District #1, Powell, WY)
Nichole Weyer, President-Elect (Hot Springs County School District #1,
Thermopolis, WY)
Bruce Jolley, Vice President (Big Horn County School District #2,
Lovell, WY)
Janine Bay-Teske, Past President (Teton County School District #1,
Jackson, WY)
4:15 PM Wyoming Education Association
Kathy Vetter, President
Tate Mullen, Government Relations Director

District Management Group | Helping Schools and Students Thrive | www.dmgroupK12.com
166
6c. Appendix C - Sample Schedule for Large District Visit
Day 1:
Time
Participants
DMGroup Interviewer 1
DMGroup Interviewer 2
8 - 8:45am
Superintendent
8:45 - 9:30am
Chief Academic Officer
Other Academic Leadership
9:30 - 10:15am
Business Manager
Other Business Leaders
(e.g. Grants Manager)
10:15 - 11am
Director of Special
Education
Other Special Education
Leadership
11 - 11:45am
Principals (Elementary)
Principals (Secondary)
11:45am -
12:30pm
Lunch
Lunch
12:30 - 1:15pm
Special Education Teachers
(Elementary, Mild to
moderate)
Special Education Teachers
(Elementary, Severe needs)
1:15 - 2pm
Special Education Teachers
(Secondary, Mild to
moderate)
Special Education Teachers
(Secondary, Severe needs)
2 - 2:45pm
General Education
Teachers (Elementary)
General Education
Teachers (Secondary)
2:45 - 3:30pm
Psychologists
Social Workers
3:30 - 4:15pm
Speech Pathologists,
Occupational Therapists,
Physical Therapists
Paraprofessionals
(Elementary)
4:15 - 5pm
Interventionists
Paraprofessionals
(Secondary)

District Management Group | Helping Schools and Students Thrive | www.dmgroupK12.com
167
Day 2:
Time
DMGroup Interviewer 1
DMGroup Interviewer 2
8 - 9am
Elementary School Visit 1
Elementary School Visit 2
9:30 - 10:30am
Elementary School Visit 3
Elementary School Visit 4
11am - 12pm
Middle School Visit 1
Middle School Visit 2
12 - 1pm
Lunch
Lunch
1 - 2pm
Middle School Visit 3
High School Visit 1
2:30 - 3:30pm
High School Visit 2
High School Visit 3

District Management Group | Helping Schools and Students Thrive | www.dmgroupK12.com
168
6d. Appendix D – Sample Schedule for Small District Visit
DMGroup Interviewer 1 Schedule:
Time
District Participants
8 - 8:45am
Superintendent
8:45 - 9:30am
Academic Leadership
9:30 - 10:15am
Business Manager
10:15 - 11am
Director of Special Education
11 - 11:45am
Principals
11:45am - 12:30pm
Lunch
12:30 - 1:15pm
Special Education Teachers (Elementary)
1:15 - 2pm
Special Education Teachers (Secondary)
2 - 2:45pm
General Education Teachers (Elementary)
2:45 - 3:30pm
General Education Teachers (Secondary)
3:30 - 4:15pm
Psychologists & Social Workers
District Management Group | Helping Schools and Students Thrive | www.dmgroupK12.com
169
DMGroup Interviewer 2 Schedule:
Time
District Participants
8 - 9am
Elementary School Visit
9:30 - 10:30am
Middle School Visit
11am - 12pm
High School Visit
12 - 1pm
Lunch
1 - 1:45pm
Paraprofessionals (Elementary)
1:45 - 2:30pm
Paraprofessionals (Secondary)
2:30 - 3:15pm
Interventionists / specialists
3:15 - 4pm
Speech Pathologists, Occupational Therapists, Physical
Therapists

District Management Group | Helping Schools and Students Thrive | www.dmgroupK12.com
170
6e. Appendix E - WDE Special Education Data Request
Below is a table outlining the data DMGroup requested from WDE. Two items
(out of district placements and teacher turnover rates) were unavailable for
collection.
Data Title/ Type
Brief Description
Existing models for
distributing funds to
districts
The most up-to-date versions of Wyoming’s existing
funding models for distributing funds, especially special
education funds, to districts.
All special education &
funding policies and
statutes
All state statutes and policies that dictate special education
spending, funding, reimbursement, and services.
Special education
revenues &
expenditures
3-5 years of special education revenue sources and
amounts and expenditures by district.
Enrollment
3-5 years of enrollment information (general education
and special education) by subgroup (below):
• District
• School
• Grade
• Race/Ethnicity
• Socio-economic status (FRL)
• ELL status
Student achievement
data
2 years of WY-TOPP and WY-ALT student achievement data
for all students and students with disabilities, by district,
grade, and subject.
Student attendance data
3-5 years of student attendance rates by district, broken out
by student subgroup if possible.
Discipline Information
3-5 years of information on student in-school suspensions,
out of school suspensions, and expulsions by district,
broken out by student subgroup if possible.

District Management Group | Helping Schools and Students Thrive | www.dmgroupK12.com
171
Data Title/ Type
Brief Description
Special education
staffing
3-5 years of FTEs of special education staff by district
including
• Special education teachers
• Special education paraprofessionals
• Adaptive PE
• Speech and language pathologists
• Occupational therapists
• Physical therapists
• Psychologists
• Counselors
• Social worker
Special education staff
on exception
authorizations
3-5 years of FTEs of special education teachers and general
education teachers on exception authorizations by district
and school level.
Special education staff
turnover rates
3-5 years of turnover rates by district for special education
teachers, special education paraprofessionals, social workers,
psychologists, and related services staff employed by the
district (OT, PT, and SLPs)
Special education
identification rates
3-5 years of special education identification rates by
district. For each district, breakdown the number of
students identified by subgroup.
Out of district placements
& costs
3-5 years (including 2019-2020) of the number of out of district
placements by district and OOD placements as a percentage of
the district’s special education population. For each OOD,
include where students are attending, their disability, and the
cost per year for tuition and transportation.
Avg. salary and benefits
for staff positions
The average salary and benefits for all special education
roles in the district including
• Special education teachers
• Special education paraprofessionals
• Adaptive PE
• Speech and language pathologists
• Occupational therapists
• Physical therapists
• Psychologists

District Management Group | Helping Schools and Students Thrive | www.dmgroupK12.com
174
Table of Contents
Introduction ................................................................................................................................ 175
I. Revise State Guidance on IDEA, Part B Supplement not Supplant and Excess Cost
Requirements .............................................................................................................................. 176
A. Excess Cost .......................................................................................................................... 176
Federal Excess Cost Requirements ...................................................................................... 177
Wyoming Approach to Excess Cost ..................................................................................... 178
Effect of Wyoming’s Excess Cost Approach on Spending and Services .............................. 179
B. Supplement not Supplant ................................................................................................... 181
Federal Supplement not Supplant Requirement for Local Spending under IDEA, Part B ... 181
Wyoming’s Approach to Supplement not Supplant at the Local Level in IDEA .................. 181
II. Revise State Spending Guidance to Reflect Expanded Spending Options.............................. 182
III. Update State Monitoring Tools to Reflect the New Guidance .............................................. 184

District Management Group | Helping Schools and Students Thrive | www.dmgroupK12.com
175
Introduction
The District Management Group (DMG) engaged Federal Education Group, PLLC to review
materials related to the Wyoming Department of Education’s (WDE) implementation of IDEA,
Part B’s spending and related fiscal rules and report on:
• The extent to which the materials are consistent with federal spending and fiscal
requirements, and
• The extent to which the materials reflect available federal flexibilities.
In general, we observed that, consistent with federal requirements, Wyoming State Rules place
a high priority on educating students with disabilities in the least restrictive environment.
40
For
example, State Rules require modifications to the general curriculum where feasible over
removing students with disabilities from their regular classrooms.
41
WDE’s approach to IDEA, Part B spending rules, however, potentially limits support for students
with disabilities in general education settings. Specifically:
• State guidance on two IDEA, Part B fiscal rules – supplement not supplant and excess
cost – are inconsistent with federal law in ways that restrict spending and services, and
• Federal law permits school districts and other local educational agencies (LEAs) to spend
IDEA, Part B funds on a broader range of activities than is reflected in the State’s
materials.
Based on these observations we recommend the State:
• Revise State guidance on IDEA, Part B excess cost and supplement not supplant
requirements,
• Revise State spending guidance to reflect expanded spending options, and
• Update State monitoring tools to reflect the new guidance.
Each of these recommendations is discussed in more detail below.
Importantly, we recognize circumstances have changed significantly since we were first
engaged for this project. The United States is now in a state of emergency due to the COVID-19
pandemic. Schools across the country have closed, which significantly affects all students, but
particularly students with disabilities. This report, to the extent possible, takes this into
account and identifies ways the State and its LEAs can use IDEA, Part B funds to meet the needs
of students with disabilities in this new environment.
40
Wyoming Administrative Rules, Chapter 7, Section 5(b).
41
Wyoming Administrative Rules, Chapter 7, Section 5(b)(vii).

District Management Group | Helping Schools and Students Thrive | www.dmgroupK12.com
176
I. Revise State Guidance on IDEA, Part B Supplement not Supplant and
Excess Cost Requirements
IDEA, Part B is governed by three fiscal rules, each of which is intended to ensure LEAs use
IDEA, Part B funds to expand services for students with disabilities rather than replace the state
and local money they would otherwise spend on such students:
1. Maintenance of effort (MOE), which requires LEAs to budget and spend at least
as much local (or state and local) money on special education as they did the year
before,
2. Excess cost, which requires LEAs to spend, on average, the same amount of non-
IDEA II money on children with disabilities as they spend on children in the LEA as a
whole, and
3. Supplement not supplant, which prohibits LEAs from using IDEA, Part B funds to
replace the state, local, and other federal funds they would otherwise spend on
special education if they did not participate in IDEA.
While WDE’s approach to MOE appears to be consistent with federal rules,
42
its guidance on
excess cost and supplement not supplant is inconsistent with federal requirements.
A. Excess Cost
LEAs must use IDEA, Part B funds
43
to pay for the “excess cost” of providing special education
and related services to eligible students with disabilities.
44
This is the cost above and beyond
what an LEA spends, on average, to educate students generally.
45
In other words, LEAs spend a
certain amount of money to provide services to all students. Students with disabilities need
extra supports that generate additional costs for LEAs. IDEA is meant to help defray these
additional costs, not the entire cost of educating a student with a disability.
46
42
Please note we did not review the State’s MOE guidance for legal sufficiency. Our review was limited to
determining whether the State’s approach, in general, is consistent with federal guidelines.
43
IDEA, Part B includes two grant programs that help school districts provide a free appropriate public
education to students with disabilities: (1) the Grants to States for Education of Children with Disabilities
program (authorized under Section 611 of IDEA) to support students with disabilities ages 3 to 21, and (2) the
Preschool Grants for Children with Disabilities program (authorized under Section 619 of IDEA) to support
students with disabilities ages 3 to 5.
44
34 CFR § 300.202(a)(2).
45
34 CFR § 300.16.
46
The excess cost requirement does not prevent a district from using IDEA, Part B funds to pay for the
entire cost of educating a child with a disability aged 3-5 or 18-21 if the district does not use state and/or
local funds to provide services to non-disabled students in those age ranges. 34 CFR § 300.202(b)(1)(ii). In

District Management Group | Helping Schools and Students Thrive | www.dmgroupK12.com
177
Determining excess cost is done through a process that looks at a district’s aggregate
spending.
47
It is not done by looking at individual expenses; yet some WDE guidance describes
it that way.
Federal Excess Cost Requirements
To meet IDEA’s excess cost requirement, LEAs must determine how much, on average, they
spent per student in the last school year,
48
after deducting:
• Capital outlay and debt services,
• Costs paid with IDEA, Part B, Title I, Part A, and Title III, Part A funds,
• Costs paid with state and local funds for programs under Title I, Part A, Title III, Part A,
and
• Costs paid with state and local funds for children with disabilities.
49
The resulting amount represents the minimum an LEA must spend in the next school year with
non-IDEA funds (that is, state, local and/or other federal funds).
For example, if an LEA with 100 elementary school students spent, on average, $7,362 per
elementary student in 2019-2020, it must spend at least $736,200 in non-IDEA funds in 2020
-2021.
50
There is no requirement to link an LEA’s allowable use of IDEA funds to any
individual “excess cost.”
Please note LEAs do not have to prove they spent the minimum amount before spending IDEA,
Part B funds. Instead, LEAs must show they spent the minimum amount by the end of the
year.
51
For instance, in the example above, the LEA can begin spending IDEA, Part B funds at
the start of the 2020-2021 school year as long as the State approves the LEA’s application for
funds. By the end of that year, the LEA must show it also spent at least $736,200 in non-IDEA
funds.
other words, if the district does not normally serve students in those age ranges, but serves a student with
disabilities solely because of the district’s responsibilities under IDEA, Part B, the district may use IDEA,
Part B funds to pay for the entire cost of educating a student in that age range.
47
2 CFR § 300.16, 2 CFR § 300.202(b)(2).
48
Districts must separately calculate the per-student amount for elementary school students and the per-
student amount for secondary school students.
49
34 CFR § 300.16.
50
2 CFR Part 300, Appendix A.
51
U.S. Department of Education, PowerPoint Presentation on Excess Cost, (2012), available at
https://osep.grads360.org/#communities/pdc/documents/4882, at slide 6.

District Management Group | Helping Schools and Students Thrive | www.dmgroupK12.com
178
Wyoming’s Approach to Excess Cost
WDE has an excess cost verification manual that appears to be based on the federal
requirements described above. Several other WDE guidance documents, however, describe
three criteria each cost supported with IDEA, Part B funds must satisfy to be considered an
excess cost as follows:
When determining whether an expenditure is an excess cost, consider these guiding
questions:
In the absence of special education and related services, would this cost exist?
If the answer is…
• No, it is an excess cost.
• Yes, it is not considered an excess cost and is not allowed.
Is this expenditure also generated by students without disabilities?
If the answer is…
• No, then the expenditure is an excess cost.
• Yes, then the expenditure is not an excess cost and is not allowed.
If it is a child specific service, is the service documented in the student’s IEP?
If the answer is…
• Yes, then the expenditure is an excess cost.
• No, then the expenditure is not an excess cost and is not allowed.
52
These three criteria do not come from federal law or guidance but are a common
misperception of how to test for excess cost compliance. To the best of our knowledge, these
criteria were developed (incorrectly) by one state and then widely referenced by others. We
recommend Wyoming move away from these three criteria for two reasons.
First, the criteria do not satisfy IDEA, Part B excess cost requirements. For example, ED
determined a state failed to comply with excess cost rules even though it applied the same
three criteria to IDEA, Part B spending.
53
In response to the finding, that state developed new
52
See, for example, Wyoming Department of Education, Reference Guide: LEA Spending of IDEA Funds,
available at https://1ddlxtt2jowkvs672myo6z14-wpengine.netdna-ssl.com/wordpress/wp-
content/uploads/2015/11/Guidance-re.-LEA-Spending-of-IDEA-Funds.pdf.
53
A copy of OSEP’s monitoring report is available at
https://dpi.wi.gov/sites/default/files/imce/sped/pdf/fy12-osep-fm-letter.pdf.

District Management Group | Helping Schools and Students Thrive | www.dmgroupK12.com
179
procedures and a technical assistance manual that make clear the excess cost rule “looks at an
LEA’s program broadly rather than at individual costs.”
54
Second, as described in more detail below, the three criteria restrict IDEA Part, B spending and
service options.
Effect of Wyoming’s Excess Cost Approach on Spending and Services
As discussed in more detail in Section II of this report, ED guidance says, “IDEA, Part B funds can
be used for a wide variety of strategies to improve student outcomes.”
55
In some cases, an LEA
might choose to use Part B funds “to exclusively support the unique special education and
related services needs of students with disabilities.”
56
In other cases, an LEA might choose to
coordinate Part B with other funding sources “to improve outcomes for all students, including
students with disabilities.”
57
For example, an LEA could use a combination of IDEA, Part B and Title II, Part A to train all its
teachers on effective strategies for supporting struggling readers. IDEA, Part B could pay the
share of costs related to special education teachers and Title II, Part A could pay the rest. This
might be particularly important for LEAs that have transitioned to remote learning as a result of
COVID-19 whose teachers need supports to help struggling learners in new environments. It
could be relevant when school resumes and an LEA needs to respond to learning loss for
struggling readers.
It does not appear, however, that Wyoming would permit this type of spending since it is not
unique to students with disabilities which would theoretically violate criteria one and two of
the State’s excess cost test. This not only limits spending, but also shapes how LEAs deliver
services to students.
For example, the three criteria might discourage LEAs from using the same effective services for
students with and without disabilities since they appear to prohibit an LEA from using IDEA,
Part B funds on a service if the same service is also provided to nondisabled students. This is
not required by federal law and runs counter to ED guidance that recognizes students with and
54
https://dpi.wi.gov/sites/default/files/imce/sped/pdf/excess-cost-calculation-guide.pdf and
https://dpi.wi.gov/sped/educators/fiscal/excess-cost.
55
U.S. Department of Education, Non-Regulatory Guidance on Using ARRA Funds Provided Through Part B of the
Individuals with Disabilities Education Act (IDEA) to Drive School Reform and Improvement, (2009), p. 4,
available at https://www2.ed.gov/policy/gen/leg/recovery/guidance/idea-b-reform.pdf. Please note ED
developed this guidance to help districts spend the additional IDEA, Part B funds appropriated through the
American Recovery and Reinvestment Act, but it applies to regular IDEA, Part B funds as well. The
guidance will be referred to as 2009 IDEA Reform Guidance from now on.
56
2009 IDEA Reform Guidance, p. 2.
57
2009 IDEA Reform Guidance, p. 2.

District Management Group | Helping Schools and Students Thrive | www.dmgroupK12.com
180
without disabilities often benefit from the same interventions and encourages alignment to the
extent possible.
58
The test might also discourage LEAs from delivering supports to students with disabilities inside
regular education classrooms if they are perceived to relate to “regular education” rather than
special education. As ED has made clear, however:
The fact that some [special education] services may also be considered “best teaching
practices” or “part of the district’s regular education program” does not preclude those
services from meeting the definition of “special education” . . . and being included in the
child’s IEP. The [LEA] must provide a child with a disability specially designed instruction
that addresses the unique needs of the child that result from the child’s disability, and
ensures access by the child to the general curriculum, even if that type of instruction is
being provided to other children, with or without disabilities, in the child’s classroom,
grade, or building.
59
For example, a student with dyslexia might need additional supports to access the school’s
reading curriculum. Depending on the student’s needs, those supports could include (among
many others): training the student’s classroom teacher on how to modify instruction for the
student, providing the student with adapted materials in class, providing the student with
appropriate accommodations, or more intensive interventions delivered outside of the general
classroom. Any of those supports would be a special education service under federal law and
could be supported with IDEA, Part B funds, even those delivered in class by the classroom
teacher.
60
Last, the three criteria might incentivize districts to spend IDEA, Part B funds only on discrete
services required by a student’s individualized education plan instead of more comprehensive
approaches to improving outcomes for students with disabilities. While LEAs can choose to
spend IDEA, Part B on discrete services, they can also spend on broader strategies to improve
schools for students with disabilities.
61
(See Section II and the Appendix for examples.)
58
2009 IDEA Reform Guidance. OSEP even permits non-disabled students to participate in an IDEA, Part B
funded intervention when it does not increase the cost for the Part B program. U.S. Department of
Education, Letter to Couillard, (2013), available at http://www2.ed.gov/policy/speced/guid/idea/letters/2013-
1/couillard03072013useoffunds1q2013.doc.
59
U.S. Department of Education, Letter to Chambers, (2012), available at
https://www2.ed.gov/policy/speced/guid/idea/memosdcltrs/11-026517r-ma-chambers-definitions-5-4-
12.doc.
60
See, for example, 2009 IDEA Reform Guidance at pp. 2-4.
61
See, for example, 2009 IDEA Reform Guidance at p. 2.

District Management Group | Helping Schools and Students Thrive | www.dmgroupK12.com
181
B. Supplement not Supplant
LEAs must use IDEA, Part B funds to supplement State, local, and other federal funds and not to
supplant those funds.
62
In general, this means IDEA, Part B funds must add to the state, local,
and other federal funds districts spend for special education, and not to replace those funds.
Like excess cost, compliance with IDEA, Part B’s supplement not supplant requirement is not
based on testing individual expenses; yet, the State has described it that way.
Federal Supplement not Supplant Requirement for Local Spending under IDEA, Part B
LEAs comply with IDEA, Part B’s supplement not supplant requirement by meeting their MOE
obligations.
63
In other words, an LEA that satisfies MOE satisfies supplement not supplant as
well. There is no separate supplement not supplant test for IDEA, Part B at the local level.
64
Wyoming’s Approach to Supplement not Supplant at the Local Level in IDEA, Part B
When describing how to test supplement not supplant compliance at the local level, WDE
describes two “presumptions” of supplanting, meaning there are two situations in which WDE
will presume supplanting occurred:
1. If an LEA uses IDEA, Part B funds to provide services it is required to make available
under other federal, State, or local laws or policy.
2. If an LEA uses IDEA, Part B funds to provide services for students with disabilities that
the LEA also provides for non-disabled students.
65
These presumptions do not apply to IDEA, Part B funds.
62
34 CFR § 300.202(a)(3).
63
See U.S. Department of Education, Non-Regulatory Guidance on Funds for Part B of the
Individuals with Disabilities Education Act Made Available Under The American Recovery and Reinvestment Act of
2009 (2010), http://www2.ed.gov/policy/gen/leg/recovery/guidance/idea-b-revised-910.pdf, at p. 13, Q&A C-
6. Please note ED developed this guidance to help districts spend the additional IDEA, Part B funds
appropriated through the American Recovery and Reinvestment Act, but it applies to regular IDEA, Part B
funds as well. The guidance will be referred to as 2009 IDEA Guidance from now on.
64
Note that the federal OMB Compliance Supplement, which is the guide that auditors use when
conducting annual Single Audits, states that supplement not supplant is “not applicable” to local level IDEA,
Part B spending: https://www.whitehouse.gov/wp-content/uploads/2019/07/2-CFR_Part-200_Appendix-
XI_Compliance-Supplement_2019_FINAL_07.01.19.pdf, at p. 4-84.027-10.
65
WDE email to Converse County (Aug. 8, 2019).

District Management Group | Helping Schools and Students Thrive | www.dmgroupK12.com
182
Supplement not supplant is tested differently in different federal education programs. While
some ED programs use presumptions to test compliance with supplement not supplant,
66
ED
does not use them for IDEA funds. As ED guidance explains:
Prior to 1992, the Part B regulations also included a “particular cost test” for
determining whether supplanting occurred. This requirement meant, for example, that
if an LEA spent Part B funds to pay for a teacher’s salary that was previously paid for
with state or local funds, a supplanting violation would occur, even though the total
amount of state and local funds spent on special education is greater than the amount
spent the previous year. At that time, an LEA could maintain effort but still violate the
supplement/not supplant provision. The “particular cost test” removed from the
regulations by an amendment published in the Federal Register on August 19, 1992 (37
FR 37652) and that became effective on October 3, 1992. Therefore, no requirement
currently exists related to supplanting “particular costs and if an LEA maintains local, or
state and local, effort, it will not violate the supplement/not supplant requirements of
the IDEA.
67
(Emphasis added.)
In other words, compliance with IDEA, Part B’s supplement not supplant requirement is not
tested by looking at individual costs.
This is important for spending and services because, as described above and in Section II below,
federal law allows LEAs to spend IDEA, Part B funds to provide services for students with
disabilities that the LEA also provides to non-disabled students.
II. Revise State Spending Guidance to Reflect Expanded Spending Options
WDE advises “only cost items that are specially designed to meet the unique needs of students
with disabilities may be funded with IDEA, Part B funds.”
68
This is not consistent with ED
guidance.
First, ED recognizes that students with and without disabilities often benefit from the same
services. For example, ED guidance describes ways IDEA, Part B can support small group
instruction that includes both students with and without disabilities.
69
ED guidance also
describes ways IDEA-funded staff can participate in co-teaching models where students with
and without disabilities are instructed in the same classes through the same lesson plans.
70
66
For example, Title II, Part A, Title III, Part A, and Title IV, Part A of ESEA use two presumptions of
supplanting to test for compliance with supplement not supplant.
67
2009 IDEA Guidance at footnote 1, p. 13.
68
WDE email to Converse County (Aug. 8 2019).
69
Letter to Couillard.
70
Letter to Couillard.

District Management Group | Helping Schools and Students Thrive | www.dmgroupK12.com
183
Ultimately, ED “encourages States and LEAs to use a variety of service delivery models to meet
their responsibilities to educate children with disabilities in the least restrictive environment,
provided all requirements of Part B are met.”
71
Second, ED guidance permits, and even encourages, LEAs to spend IDEA, Part B funds on
initiatives that meet the needs of all students including students with disabilities.
72
IDEA, Part B
could not pay the entire share of such an initiative, but ED suggests a variety of ways LEAs could
apportion costs among several funding sources consistent with federal cost principles and other
spending rules.
73
For example, an LEA can use IDEA, Part B funds to:
• Increase teacher effectiveness and address inequities in the distribution of effective
teachers, such as dual certification, induction and mentoring, using technology for
instruction, and assistive technology,
• Adopt college and career-ready standards and high-quality assessments, such as
universal design for learning, response to intervention, literacy, math, and behavior
interventions, social and emotional supports, and transition services, and
• Establish data systems and use data for improvement, such as student progress
monitoring, web-based IEPs, and data systems.
74
A detailed list of activities that can be paid for with IDEA, Part B funds is available in the
Appendix.
In short, ED’s guidance clarifies that LEAs can coordinate IDEA, Part B with other funding
sources to improve general education settings so they better serve students with disabilities as
long as students with disabilities benefit and IDEA pays its fair share of the cost.
The ability to coordinate IDEA, Part B with other funding sources may be particularly important
now in light of COVID-19. For example, LEAs might want to explore ways they can contribute
IDEA, Part B funds to:
71
Letter to Couillard.
72
2009 IDEA Reform Guidance, p. 2.
73
For example, U.S. Department of Education, Letter to Hokenson, (2013), available at
https://www2.ed.gov/policy/speced/guid/idea/letters/2013-1/hokenson01302013leamoe1q2013.pdf; U.S.
Department of Education, Letter to DeTemple, (2009), available at
https://www2.ed.gov/policy/speced/guid/idea/letters/2009-1/detemple011509stateactivities112009.pdf;
2009 IDEA Reform Guidance.
74
2009 IDEA Reform Guidance, pp. 6-37.

District Management Group | Helping Schools and Students Thrive | www.dmgroupK12.com
184
• Training efforts to help classroom teachers support students with different needs,
including students with disabilities, during online learning,
• Developing behavior support systems appropriate for online learning,
• Deploying social and emotional supports virtually,
• Adapting online curricula and instructional materials to support students with different
needs, including students with disabilities,
• Acquiring devices for students with disabilities so they can access online learning, and
• Academic and career counseling for high school students whose needs and
postgraduation plans have changed given COVID-19.
To help LEAs understand their spending options – whether specific to COVID-19 or more
generally – Wyoming could revise and expand its spending guidance. Currently, State guidance
provides a list of budget items and describes whether they are or are not allowed under IDEA,
Part B.
75
Instead, the State might consider guidance that helps to connect allowable IDEA, Part
B spending to effective practices.
For example, this guidance from the Mississippi Department of Education gives examples of
ways LEAs can use IDEA, Part B funds to support effective literacy practices (including response
to intervention, effective teaching, and data systems). This guidance from the Tennessee
Department of Education goes further and gives examples of ways LEAs can coordinate Title I,
Part A, Title II, Part A and IDEA, Part B funds to support response to intervention activities.
76
III. Update State Monitoring Tools to Reflect the New Guidance
Wyoming uses a consolidated grant monitoring process to oversee local compliance with
several ED grant programs including IDEA, Part B. If the State updates its excess cost,
supplement not supplant, and spending guidance as suggested above, it would need to update
its monitoring tools as well.
For example, the State’s current monitoring instrument suggests supplement not supplant is
tested by looking at individual expenses charged to IDEA, Part B.
77
As described in Section I.B
75
WDE Reference Guide: LEA Spending of IDEA Funds.
76
Please note this guidance was developed under the No Child Left Behind Act, so some aspects of the
guidance as they relate to Title I and Title II are out of date. This guidance is included only as an example
of a type of guidance the State might consider.
77
Wyoming Department of Education, ESSA/Perkins/IDEA/McKinney-Vento Consolidated Grant Monitoring
Requirements (2019), available at https://1ddlxtt2jowkvs672myo6z14-wpengine.netdna-ssl.com/wp-
content/uploads/2019/11/Federal-Programs-Monitoring-Protocol-2019-2020-11.15.2019.pdf.

District Management Group | Helping Schools and Students Thrive | www.dmgroupK12.com
185
above, this is not how local compliance with IDEA’s supplement not supplant requirement is
tested. LEAs that satisfy MOE requirements satisfy supplement not supplant as well.
The State’s monitoring instrument also includes a review of costs charged to IDEA, Part B.
While the instrument does not describe how monitoring staff will determine whether costs
were allowable, the criteria applied should be consistent with State guidance on the allowable
use of IDEA, Part B funds and ideally would reflect the full range of costs permitted federal law.
Finally, although beyond the scope of our engagement, we note there are opportunities to
refine the State’s monitoring instrument to enhance consistency and minimize burdens. For
example, it appears each program reviews time and effort and inventory management
compliance separately. The same time and effort and inventory management rules apply to all
programs, so this could be monitored jointly. Also, the monitoring instrument presumes LEAs
use employee certifications (semi-annual certifications and personnel activity reports) to
comply with time and effort requirements. This is one way LEAs can comply, but federal
regulations permit other options as well.
78
The State may wish to consider expanding the
instrument to reflect those additional options.
78
Employee certifications are the most common way of documenting time and effort. Before 2014, federal
regulations required such certifications. Certifications for employees who worked on one cost objective
were called “semi-annual certifications” and had to be signed every six months by either the employee or a
supervisor with first-hand knowledge of the work performed. Certifications for employees who worked on
multiple cost objectives were called “personnel activity reports” and had to be signed by the employee
monthly. Now, federal regulations permit other kinds of time and effort records as well if they meet
criteria listed in 2 CFR § 200.431(i)(1)(i)-(vii).

District Management Group | Helping Schools and Students Thrive | www.dmgroupK12.com
186
6g. Appendix G - Chart of Activities Districts Can Support with IDEA,
Part B Funds
Based on the U.S. Department of Education’s Non-Regulatory Guidance on Using
ARRA Funds Provided Through Part B of the Individuals with Disabilities
Education Act (IDEA) to Drive School Reform and Improvement. Available at:
https://www2.ed.gov/policy/gen/leg/recovery/guidance/idea-b-reform.pdf
Strategy to
Support
SWDs
Cost that Could be Paid for with IDEA, Part B Funds to
Implement the Strategy
Access to
effective
teachers
• Hiring effective, dually certified special education teachers,
• Paying for teachers to participate in high-quality certification
programs that increase teacher effectiveness in improving
outcomes for students with disabilities,
• Providing site-based, job-embedded professional development
for special education teachers that leads to certification in
content areas through partnerships with an institution of
higher education (IHE) and/or a recognized alternative
certification program,
• Providing site-based, job-embedded professional development
for general education teachers that leads to certification in
special education through partnerships with an IHE and/or a
recognized alternative certification program,
• Induction programs that use evidence-based practices such as
creating ongoing support and opportunities for interaction
between novice and experienced special education teachers
(e.g., classroom observations, advising, group meetings for
grade-level teams, and networking within and outside of the
school),
• Teacher mentoring programs, including the cost of hiring
substitute teachers to provide release time for special
education teacher mentors, and
• Training mentors in adult development and learning,
conferencing skills, and relationship and communication
skills to work with special education teachers.

District Management Group | Helping Schools and Students Thrive | www.dmgroupK12.com
187
Strategy to
Support
SWDs
Cost that Could be Paid for with IDEA, Part B Funds to
Implement the Strategy
Use of
technology
• Paying for staff time outside the school day and for substitute
teachers for release time during the school day, so special
education staff can engage in a technology self-assessment
and strategic planning,
• Purchasing technology hardware and software consistent with
the district’s established technology integration plan to
improve achievement for students with disabilities and to
increase their access to the curriculum,
• Providing professional development and technical assistance
to special education staff on the purchase and use of
instructional technology, and
• Promoting the effective use of technology to improve
instruction for students with disabilities by providing
professional development and technical assistance and
developing teacher mentor programs and communities of
practice.
Assistive
technology
(AT)
• Purchasing AT devices and services for students with
disabilities and providing training for teachers and other
service providers, administrators, parents, and children,
• Establishing AT labs or lending libraries with a collection of
AT devices and materials for use in AT evaluations and
training, and
• Providing training on how to conduct a systematic analysis of
the child’s specific needs and abilities, the environments in
which the child must function, the tasks the child must
perform, and the AT devices that may benefit the child.
Universal
Design for
Learning
• Purchasing assessments that utilize UDL approaches to ensure
that assessments of students with unique learning needs are
valid measures of their knowledge,
• Providing professional development related to UDL
approaches and strategies for supporting emergent literacy,
reading and math instruction, learners with disabilities in K-
12, and the use of new technologies with evidence-based
strategies for improved outcomes,

District Management Group | Helping Schools and Students Thrive | www.dmgroupK12.com
188
Strategy to
Support
SWDs
Cost that Could be Paid for with IDEA, Part B Funds to
Implement the Strategy
• Providing professional development related to the
implementation of embedded assessments intended to inform
the development of improved teaching and learning
strategies,
• Purchasing consultant services to plan and implement new
learning environments supportive of all learners within
inclusive settings,
• Providing professional development related to the
implementation of appropriate accommodations for children
with disabilities on large scale assessments,
• Providing professional development related to the acquisition
and use of specialized formats to support students with
disabilities within the least restrictive environment, and
• Acquiring and implementing technologies and specialized
formats for students with print disabilities who qualify for
National Instructional Materials Accessibility Standard
derived textbooks in accordance with the Library of Congress
National Library Service guidelines and for other students
with disabilities who may not qualify under the four
categories supported by the Chafee Amendment to Copyright
Law.
Response to
Intervention
(RTI)
• Providing any special education and related services that is in
a child's IEP, regardless of the tier the child is in,
• Developing a district strategy for implementing an RTI
framework that provides guidance on tiers of instruction and
the instructional approaches and programs appropriate for
each tier, appropriate use of assessment data, supports needed
for implementation, and evaluation of effectiveness of
approach,
• Purchasing curriculum-based screening and progress
monitoring and formative assessment measurement
instruments, and curriculum materials for intensive
instruction,

District Management Group | Helping Schools and Students Thrive | www.dmgroupK12.com
189
Strategy to
Support
SWDs
Cost that Could be Paid for with IDEA, Part B Funds to
Implement the Strategy
• Providing professional development for school or district staff
to appropriately and effectively use the progress monitoring
and formative assessment measurement instruments, and
• Providing professional development for school or district staff
to appropriately and effectively implement evidence-based
instructional and positive behavior practices.
Literacy
Interventions
• Purchasing evidence-based reading programs,
• Purchasing progress monitoring tools,
• Providing professional development for school staff across
content areas in the implementation of effective instruction
for students with disabilities who are struggling readers, and
• Employing and training literacy coaches to provide ongoing
training and support to teachers.
Math
Intervention
• Purchasing evidence-based math screening instruments and
intervention materials,
• Purchasing technical assistance and training in implementing
math strategies,
• Employing staff to provide technical assistance and training
in implementing math, and
• Supporting dual certification initiatives to ensure teachers can
effectively work with students with disabilities who are
struggling with math.
Positive
Behavior
Intervention
and Support
• Providing technical assistance and professional development
for teachers, service providers, and school staff for training
needed to initially implement and maintain a positive
behavioral intervention and support system (PBIS),
• Providing technical assistance and professional development
for teachers, service providers, and school staff for training
needed to initially implement and maintain a PBIS program,
including the funding for substitutes for staff release time,
• Employing and training for behavior coaches who would
support the implementation of the PBIS program and train
additional staff coaches to sustain the program,

District Management Group | Helping Schools and Students Thrive | www.dmgroupK12.com
190
Strategy to
Support
SWDs
Cost that Could be Paid for with IDEA, Part B Funds to
Implement the Strategy
• A schoolwide data system that measures school climate in a
rigorous way so that progress can be assessed and measured,
and
• Providing the specific positive behavioral interventions and
supports that are included in the IEPs of children with
disabilities including the professional development of
personnel (both special education and regular education)
involved in providing those interventions.
Social and
emotional
development
• Collaborating with other local early care and education
programs to coordinate funds consistent with regulatory
requirements, to provide professional development and fund
the hiring and training of trainers and coaches to implement a
multi-tiered framework for promoting social development
and addressing challenging behavior in young children,
• Providing technical assistance to build the capacity of their
community or district to develop the infrastructure needed to
implement a multi-tiered model for promoting social
development, including the training of trainers and coaches
and the development of model demonstration sites using
coordinated funds, and
• Hiring coaches to provide classroom and program support.
Transition
services
• Hiring transition personnel who possess the knowledge and
skills to work with teachers, businesses, employers,
community colleges, technical schools, and IHEs to create an
effective interagency transition system for students with
disabilities that fosters interagency coordination between the
school, the community, and the post-school adult service
system,
• Purchasing transition-curriculum and career assessment,
exploration, and development tools for students with
disabilities,
• Providing technical assistance and professional development
to enhance the knowledge and skills of special educators
regarding transition strategies, including how to effectively

District Management Group | Helping Schools and Students Thrive | www.dmgroupK12.com
191
Strategy to
Support
SWDs
Cost that Could be Paid for with IDEA, Part B Funds to
Implement the Strategy
use transition-curriculum and career assessment, exploration,
and development tools,
• Employing staff to provide technical assistance and
professional development to enhance the knowledge and
skills of special educators regarding transition strategies,
including how to effectively use transition-curriculum and
career assessment, exploration, and development tools, and
• Hiring consultants to integrate data regarding the provision of
transition services to students with disabilities into other data
collection systems to better support and track student
outcomes.
Data systems
• Progress monitoring tools,
• Web-based IEPs,
• Purchasing hardware and software to enhance current data
systems or purchase new data systems,
• Hiring consultants to address data challenges, including
privacy concerns and cross-departmental technical and legal
data transferability issues,
• Training personnel on how to use data for improving student
outcomes,
• Building a local longitudinal data system that is interoperable
with any existing statewide longitudinal data system, and
• Merging separate special education data systems into existing
elementary, secondary, post-secondary, and workforce
systems.

District Management Group | Helping Schools and Students Thrive | www.dmgroupK12.com
192
6h. Appendix H - Resources on the use of IDEA, Part B Funds from
Delaware Department of Education
A link to this appendix can be found here:
https://www.doe.k12.de.us/cms/lib/DE01922744/Centricity/domain/232/perform
ance%20mgmt/idea/Guidance_IDEA_Funds_4-1-17.pdf

District Management Group | Helping Schools and Students Thrive | www.dmgroupK12.com
193
6i. Appendix I - Resources on the use of IDEA, Part B Funds from
Mississippi Department of Education
A link to this appendix can be found here:
https://www.mdek12.org/sites/default/files/documents/idea-supporting-early-
literacy-fiscal-guidance-4-15-16_20160505125408_154638.pdf

District Management Group | Helping Schools and Students Thrive | www.dmgroupK12.com
194
6j. Appendix J – References
In addition to the research referenced in the footnotes, below are the Special
Education Teaching and Learning Research Studies Reviewed.
General:
• “Seeking Effective Policies and Practices for Students with Special Needs.”
Rennie Center for Education Research & Policy. Spring 2009.
• Hattie, John. Visible learning: A synthesis of over 800 meta-analyses relating
to achievement. Routledge, 2013.
• “Special Education: A Service, Not a Place.” New Jersey School Boards
Association. March 11, 2014.
• Eidelman, Hadas, Grindal, Todd, Hehir, Thomas. “Review of Special
Education in the Commonwealth of Massachusetts.” Report
commissioned by the Massachusetts Department of Elementary and
Secondary Education. April 2012.
• What Works Clearinghouse
Reading:
• A KIDS COUNT Special Report from the Annie E. Casey Foundation. “Early
Warning! Why Reading by the End of Third Grade Matters.” Annie E.
Casey Foundation, 2010.
• Armbruster, Bonnie B., Lehr, Fran, Osborn, Jean. “Put Reading First: The
Research Building Blocks for Teaching Children to Read: Kindergarten
Through Grade 3.” National Institute for Literacy: The Partnership for
Reading, 2001.
• Hernandez, Donald J. "Double Jeopardy: How Third-Grade Reading Skills
and Poverty Influence High School Graduation." Annie E. Casey
Foundation (2011).
• “Improving K-5 Literacy Outcomes.” Hanover Research, January 2015.
• Report of the National Reading Panel. “Teaching Children to Read: An
Evidence Based Assessment of the Scientific Research Literature on
Reading and Its Implications for Reading Instruction.” National Reading
Panel, 2000.
• Shanahan, Timothy, et al. "Improving Reading Comprehension in
Kindergarten through 3rd Grade: IES Practice Guide. NCEE 2010-
4038." What Works Clearinghouse (2010).

District Management Group | Helping Schools and Students Thrive | www.dmgroupK12.com
195
• Sweet, Anne P., McGuire, C. Kent, Riley, Richard W. Ten Proven Principles of
Teaching Reading. National Education Association, 2000.
• Taylor, Barbara M., and P. David Pearson, eds. Teaching reading: Effective
schools, accomplished teachers. Routledge, 2005.
• Assisting students struggling with reading: Response to intervention and
multi-tier intervention in the primary grades. US Department of
Education, National Center for Education Evaluation and Regional
Assistance, Institute
• Harlacher, J., Sanford, A., & Walker, N. (2015). “Distinguishing Between Tier
2 and Tier 3 Instruction in Order to Support Implementation of RtI.”
• Allington, Richard L. "What really matters when working with struggling
readers." The Reading Teacher 66.7 (2013): 520-530.
• What Works Clearinghouse
High Expectations & Access to General Education:
• Boser, U., Wilhelm, M., & Hanna, R. (2014, October 6). The Power of the
Pygmalion Effect: Teacher Expectations Strongly Predict College
Completion
• Rosenthal, R, and L. Jacobsen. Pygmalion in the classroom: teacher
expectation and pupils’ intellectual development. New York: Holt,
Rinehart and Winston, 1968.
• Courtade, Ginevra, et al. "Seven reasons to promote standards-based
instruction for students with severe disabilities: A reply to Ayres, Lowrey,
Douglas, & Sievers (2011)." Education and Training in Autism and
Developmental Disabilities (2012): 3-13.
• Reeves, Douglas B. Making standards work: How to implement standards-
based assessments in the classroom, school, and district. Lead+ Learn Press,
2002.
• Eidelman, Hadas, Grindal, Todd, Hehir, Thomas. “Review of Special
Education in the Commonwealth of Massachusetts.” Report
commissioned by the Massachusetts Department of Elementary and
Secondary Education. April 2012.
Targeted Interventions:
• Assisting students struggling with reading: Response to intervention and multi-
tier intervention in the primary grades. US Department of Education,

District Management Group | Helping Schools and Students Thrive | www.dmgroupK12.com
196
National Center for Education Evaluation and Regional Assistance,
Institute of Education Sciences, 2009.
• Denton, C. A.; Fletcher, J. M.; Anthony, J. L. and Francis, D. J. “An Evaluation
of Intensive Intervention for Students with Persistent Reading
Difficulties.” Journal of Learning Disabilities, 39, 447‐466, 2006.
• DuFour, Richard, DuFour, Rebecca, Robert Eaker, and Gayle
Karhanek. Whatever it takes: How professional learning communities respond
when kids don't learn. Bloomington, IN: National Educational Service, 2004.
• Kelly, Corrie. “Reading Intervention Programs: A Comparative Chart.”
Reading Rockets, 2001.
• Stiggins, Rick, and Rick DuFour. "Maximizing the power of formative
assessments." Phi Delta Kappan 90.9 (2009): 640-644.
• “Intensive Interventions for Students Struggling in Reading and Mathematics:
A Practice Guide.” Center on Instruction.
• Harlacher, J., Sanford, A., & Walker, N. (2015). “Distinguishing Between Tier
2 and Tier 3 Instruction in Order to Support Implementation of RtI.”
Quality of Teachers:
• Darling-Hammond, Linda. "Teacher quality and student achievement."
Education policy analysis archives 8 (2000): 1.
• National Council on Teacher Quality, “Teacher Prep Ratings,” 2014.
• Public Impact’s OpportunityCulture.org website
• Rice, Jennifer King. Teacher Quality: Understanding the Effectiveness of
Teacher Attributes. Economic Policy Institute, Washington, DC, 2003.
• Suh, Thomas-Fore. "The National Council on Teacher Quality: Expanding
the Teacher Quality Discussion. ERIC Digest." (2002).
• Walsh, Kate, Deborah Glaser, and Danielle Dunne Wilcox. "What education
schools aren't teaching about reading and what Elementary teachers
aren't learning." National Council on Teacher Quality (2006).
• Joyce, B., and Showers, B. “Student achievement through staff
development” (3rd ed.). Association for Supervision and Curriculum
Development, 2002.
• Block, Cathy Collins, Margaret Oakar, and Nicholas Hurt. "The expertise of
literacy teachers: A continuum from preschool to grade 5." Reading
Research Quarterly 37.2 (2002): 178-206.
• Teachers Matter: Understanding Teachers’ Impact on Student
Achievement.” RAND Corporation.

District Management Group | Helping Schools and Students Thrive | www.dmgroupK12.com
197
• Goe, Laura, and Leslie M. Stickler. "Teacher Quality and Student
Achievement: Making the Most of Recent Research. TQ Research & Policy
Brief." National Comprehensive Center for Teacher Quality (2008).
• Harris, Douglas N., and Tim R. Sass. "Teacher training, teacher quality and
student achievement." Journal of public economics 95.7 (2011): 798-812.
• Taylor, Barbara M., and P. David Pearson, eds. Teaching reading: Effective
schools, accomplished teachers. Routledge, 2005.
• Taylor, Barbara M., Michael Pressley, and David Pearson. "Effective
Teachers and Schools: Trends across Recent Studies." (2000).
• Mioduser, David, Hanna Tur‐Kaspa, and Irit Leitner. "The learning value
of computer‐based instruction of early reading skills." Journal of
computer assisted learning 16.1 (2000): 54-63.
• Allington, Richard L. "What at-risk readers need." Educational Leadership.
68.6 (2011): 40-45.
• Vaughn, S., Wanzek, J., Murray, C. S., Roberts, G. (2012). Intensive
interventions for students struggling in reading and mathematics: A
practice guide. Portsmouth, NH: RMC Research Corporation, Center on
Instruction.
• Gersten, R., Compton, D., Connor, C.M., Dimino, J., Santoro, L., Linan-
Thompson, S., and Tilly, W.D. (2008). Assisting students struggling with
reading: Response to Intervention and multi-tier intervention for reading
in the primary grades. A practice guide. (NCEE 2009-4045). Washington,
DC: National Center for Education Evaluation and Regional Assistance,
Institute of Education Sciences, U.S. Department of Education. Retrieved
from http://ies.ed.gov/ncee/wwc/publications/practiceguides/.
• Vaughn, S., Denton, C., & Fletcher, J. (2010). “Why Intensive Interventions
Are Necessary For Students With Severe Reading Difficulties.” Psychol
Sch., 47(5), 432-444. Doi:10.1002.
• Harlacher, J., Sanford, A., & Walker, N. (2015). “Distinguishing Between Tier
2 and Tier 3 Instruction in Order to Support Implementation of RtI.”
• Young, Caresa Lynn. The effects of group size on reading outcomes of
identified nonresponders. Diss. Vanderbilt University, 2008.
Data & Assessment:
• Stiggins, Rick, and Rick DuFour. "Maximizing the power of formative
assessments." Phi Delta Kappan 90.9 (2009): 640-644.

District Management Group | Helping Schools and Students Thrive | www.dmgroupK12.com
198
• Reeves, Douglas B. Making standards work: How to implement standards-
based assessments in the classroom, school, and district. Lead+ Learn
Press, 2002.
• Walvoord, Barbara E. Assessment clear and simple: A practical guide for
institutions, departments, and general education. John Wiley & Sons, 2010.
• Safer, Nancy, and Steve Fleischman. "Research matters: How student
progress monitoring improves instruction." Educational Leadership 62.5
(2005): 81-83.
• “The Case for Growth: Why Measure Student Learning?” Northwest
Evaluation Association. January 2014.
• Bambrick-Santoyo, Paul. Driven by data: A practical guide to improve
instruction. John Wiley & Sons, 2010.
• Walvoord, Barbara E. Assessment clear and simple: A practical guide for
institutions, departments, and general education. John Wiley & Sons, 2010.
• “The Case for Growth: Why Measure Student Learning?” Northwest
Evaluation Association. January 2014.
Writing:
• Graham, Steve, and Karen R. Harris. "Designing an effective writing
program." Best practices in writing instruction 2 (2013): 3-25.
• Puranik, Cynthia S., et al. "Exploring the amount and type of writing
instruction during language arts instruction in kindergarten
classrooms."Reading and writing 27.2 (2014): 213-236.
• Graham, Steve, et al. "Teaching Elementary School Students to Be Effective
Writers: A Practice Guide. NCEE 2012-4058." What Works Clearinghouse
(2012).
ELL Students:
• What Works Clearinghouse; IES; Gersten, R., Baker, S. K., Collins, P., Linan-
Thompson, S., Scarcella, R., & Shanahan, T. (n.d.). Effective Literacy and
English Language Instruction for English Learners in the Elementary
Grades
• http://ell.stanford.edu/
• http://ell.nwresd.org/
• http://www.colorincolorado.org

District Management Group | Helping Schools and Students Thrive | www.dmgroupK12.com
199
• “Understanding Language: Issues and Opportunities in Improving the
Quality of Large Scale Assessment Systems for ELLs”
• Rance-Roney, J. “Best Practices for Adolescent ELLs.” Supporting English
Language Learners. Vol. 66, No. 7. April 2009.
• Bailey, A. & Heritage, M. “Evaluating the validity of English-language
proficiency assessments.” English-language proficiency assessment
foundations: External judgments of adequacy. Washington, DC: EVEA
Project. (2010).
• Cook, G., Linquanti, R., Chinen, M., & Jung, H. National evaluation of Title
III implementation supplemental report: Exploring approaches to setting
English language proficiency performance criteria and monitoring
English learner progress. Washington, DC: US Department of Education,
Office of Planning, Evaluation and Policy Development. (2012).
• Duran, R. “Assessing English-language learners’ achievement.” Review of
Research in Education. Vol. 32, 292-327. (2008).
• Kieffer, M., Lesaux, N., Rivera, M. & Francis, D. “Accommodations for
English-language learners taking largescale assessments: A meta-
analyses on effectiveness and validity.” Review of Educational Research.
Vol. 79, No. 3. 1168-1201. (2009).
• Linquanti, R. “Strengthening assessment for English learner success: How
can the promise of the common core state standards and innovative
assessment systems be realized?” In D. Plank and J. Norton (Eds.), The road
ahead for state assessments (pp. 13-25). Palo Alto & Cambridge: Policy
Analysis for California Education and Rennie Center for Education
Research & Policy. (2011).
• English Language Learners: A Policy Research Brief Produced by the
National Council of Teachers of English.
Social, Emotional, and Behavioral Supports:
• Beard, K.Y., & Sugai, G. (2004, August). First Step to Success: An Early
Intervention for Elementary Children at Risk for Antisocial Behavior.
Behavioral Disorders, 29(4), 396-409.
• Bradshaw, Catherine P., Tracy E. Waasdorp, and Philip J. Leaf. "Effects of
school-wide positive behavioral interventions and supports on child
behavior problems." Pediatrics 130.5 (2012): e1136-e1145.

District Management Group | Helping Schools and Students Thrive | www.dmgroupK12.com
200
• Bradshaw, Catherine P., Mary M. Mitchell, and Philip J. Leaf. "Examining
the effects of schoolwide positive behavioral interventions and supports
on student outcomes results from a randomized controlled effectiveness
trial in elementary schools." Journal of Positive Behavior Interventions
12.3 (2010): 133-148.
• Domitrovich, Celene E., et al. "Integrated models of school‐based
prevention: Logic and theory." Psychology in the Schools 47.1 (2010): 71-88.
• Bradshaw, Catherine P., et al. "Integrating school-wide positive behavioral
interventions and supports with tier 2 coaching to student support teams:
The PBIS plus model." Advances in School Mental Health Promotion 5.3
(2012): 177-193.
• Barrett, Susan B., Catherine P. Bradshaw, and Teri Lewis-Palmer.
"Maryland statewide PBIS initiative systems, evaluation, and next steps."
Journal of Positive Behavior Interventions 10.2 (2008): 105-114.
• Simonsen, Brandi, et al. "Evidence-based practices in classroom
management: Considerations for research to practice." Education and
Treatment of Children 31.3 (2008): 351-380.
• DeNisco, Alison. “Social-emotional learning enhances special ed and
beyond.” District Administration. January 2016.
• Durlak, Joseph A., et al. "The impact of enhancing students’ social and
emotional learning: A meta‐analysis of school‐based universal
interventions."Child development 82.1 (2011): 405-432.
• Avant, D. W., & Lindsey, B. C. (2016). School Social Workers as Response to
Intervention Change Champions. Advances in Social Work ASW, 16(2), 276.
doi:10.18060/16428
• Best Practices for Behavior Intervention Plan. (2016). Great Ideas
Convention.
• Briesch, A. M., Briesch, J. M., & Chafouleas, S. M. (2014). Investigating the
Usability of Classroom Management Strategies Among Elementary
Schoolteachers. Journal of Positive Behavior Interventions, 17(1), 5-14.
doi:10.1177/1098300714531827
• McKevitt, B. C., & Braaksma, A. D. (2008). Best Practices in Developing a
Positive Behavior Support System at the School Level. Best Practices in
School Psychology V, 14 (3), 735-748.
• Miller, L. M., Dufrene, B. A., Sterling, H. E., Olmi, D. J., & Bachmayer, E.
(2014). The Effects of Check-In/Check-Out on Problem Behavior and

District Management Group | Helping Schools and Students Thrive | www.dmgroupK12.com
201
Academic Engagement in Elementary School Students. Journal of Positive
Behavior Interventions, 17(1), 28-38. doi:10.1177/1098300713517141
• Sugai, G., & Horner, R. R. (2006). A Promising Approach for Expanding and
Sustaining School-Wide Positive Behavior Support. School Psychology
Review, 35(2), 245-259.
• Minahan, Jessica, and Nancy Rappaport. The behavior code: A practical
guide to understanding and teaching the most challenging students.
Harvard Education Press. 8 Story Street First Floor, Cambridge, MA 02138,
2012.
• Simonsen, Brandi, and George Sugai. "PBIS in alternative education
settings: Positive support for youth with high-risk behavior." Education
and Treatment of Children 36.3 (2013): 3-14.
• Macklem, Gayle L. "Engaging Families Through School/Family
Partnerships." Preventive Mental Health at School. Springer New York,
2014. 69-86.
• “School-Family Partnership Strategies to Enhance Children’s Social,
Emotional, and Academic Growth.” Collaborative for Academic, Social, and
Emotional Learning.
• El Nokali, Nermeen E., Heather J. Bachman, and Elizabeth Votruba‐Drzal.
"Parent involvement and children’s academic and social development in
elementary school." Child development 81.3 (2010): 988-1005.
• “Collaborative Family-School Relationships for Children’s Learning:
Beliefs and Practices.” Virginia Department of Education.
Paraprofessionals/Instructional Assistants:
• “A Study of the Use of Paraprofessionals to Deliver Special Education
Services in Vermont Schools”, the University of Massachusetts Donahue
Institute (UMDI), March 2015.
• Broer, Stephen M., Doyle, Mary Beth, Halvorsen, Ann T., Giangreco,
Michael F. "Alternatives to overreliance on paraprofessionals in inclusive
schools." Journal of Special Education Leadership 17.2 (2004): 82.
• Causton-Theoharis, Julie N. "The golden rule of providing support in
inclusive classrooms: Support others as you would wish to be
supported." Teaching Exceptional Children 42.2 (2009): 36-43.

District Management Group | Helping Schools and Students Thrive | www.dmgroupK12.com
202
• Giangreco, Michael F., et al. "Be careful what you wish for…”: Five reasons
to be concerned about the assignment of individual
paraprofessionals." Teaching Exceptional Children 37.5 (2005): 28-34.
• Giangreco, Michael F., Sean M. Hurley, and Jesse C. Suter. "Special
education personnel utilization and general class placement of students
with disabilities: Ranges and ratios." Journal Information 47.1 (2009).
• Giangreco, Michael F., Carter S. Smith, and Elaine Pinckney. "Addressing
the paraprofessional dilemma in an inclusive school: A program
description." Research and Practice for Persons with Severe Disabilities 31.3
(2006): 215-229.
• Mittnacht, Marcia. “Technical Assistance Advisory SPED 2014-3:
Identifying the Need for Paraprofessional Support.” Massachusetts
Department of Elementary and Secondary Education. February, 26, 2015.
• Suter, Jesse C., and Michael F. Giangreco. "Numbers that count: Exploring
special education and paraprofessional service delivery in inclusion-
oriented schools." The Journal of Special Education (2008).
Speech and Language:
• American Speech-Language-Hearing Association. "A workload analysis
approach for establishing speech-language caseload standards in the
schools: Technical report." (2002).
• American Speech-Language-Hearing Association. "Admission/discharge
criteria in speech-language pathology." (2004).
• Guidelines for the roles and responsibilities of the school-based speech-
language pathologist. American Speech-Language-Hearing Association,
2002.

District Management Group | Helping Schools and Students Thrive | www.dmgroupK12.com
203
6k. Appendix K – Maintenance of Effort (MOE) for IDEA Funds
Maintenance of Effort (MOE) for IDEA Funds
Demystifying Required Special Education Spending Levels
Updated September 2020
Any effort to manage costs in special education must ensure that the district
remains in compliance with the requirements of IDEA funding for
“Maintenance of Effort”. While the concept is simple, the actual calculation is
quite involved.
A common misconception is that federal or state laws do not allow a district to
reduce spending in special education. This is not the case. The law is much more
complex, and includes four different tests, allows for five exemptions, and has a
provision to shift some special education funds to certain general education
programs. For the vast majority of districts, a well conceived, student centered,
effective program of special education cost containment will meet the
Maintenance of Effort requirements. At its heart, the Maintenance of Effort
provision is intended to ensure that current students with disabilities are well
served, but it is not intended to forestall prudent management of special
education budgets. Of course, the district must always meet the requirements of
all IEPs and provide a Free Appropriate Public Education (FAPE).
The full text of the relevant regulations are at the end of this section.
1. There are two tests:
Maintenance of Effort regulations break down into two tests. The tests are:
1. Eligibility test: This is done before an LEA receives funds, and looks at
whether an LEA budgeted to spend at least as much local, or state and
local, money on the education of children with disabilities as it spent in
the most recent year for which final expenditure information is available.
2. Compliance test – which is done after-the-fact, and an LEA must
demonstrate it actually spent at least as much local, or state and local,
money on the education of children with disabilities as it spent in the year
before.
Each test is satisfied by meeting one of four measures:

District Management Group | Helping Schools and Students Thrive | www.dmgroupK12.com
204
A district must pass only one of the four Maintenance of Effort tests, after
applying all the allowable exemptions. The tests are:
1. Total local spending for special education in a given year (after adding back
the allowable exemptions) cannot be less than the prior year’s total local special
education spending.
Or
2. Per student local spending for special education in a given year (after adding
back the allowable exemptions) cannot be less than the prior year’s per student
local special education spending.
Or
3. Total local plus state spending for special education in a given year (after
adding back the allowable exemptions) cannot be less than the prior year’s total
local plus total state special education spending.
Or
4. Per student local plus state spending for special education in a given year
(after adding back the allowable exemptions) cannot be less than the prior year’s
per student local plus state special education spending.
Local spending includes funds from the operating budget, reserve funds, and all
other sources, except for funds received from the state or federal government.
Spending for special education teachers, administrators, other personnel,
supplies, transportation, out-of-district placements, subcontracted services,
health insurance, pensions, and other fringe benefits are included.
State spending includes any state grants or state provided funding, such as
excess out-of-district cost reimbursement or general aide used for any special
education costs.
2. Exemptions that reduce required Maintenance of Effort spending levels.
The statute provides for a number of modifications to the calculations that allow
a district to reduce spending on special education. The actual language states:

District Management Group | Helping Schools and Students Thrive | www.dmgroupK12.com
205
§ 300.204 Exception to maintenance of effort.
79
Notwithstanding the restriction in §300.203(b), an LEA may reduce the level
of expenditures by the LEA under Part B of the Act below the level of those
expenditures for the preceding fiscal year if the reduction is attributable to any
of the following:
(a) The voluntary departure, by retirement or otherwise, or departure for
just cause, of special education or related services personnel.
(b) A decrease in the enrollment of children with disabilities.
(c) The termination of the obligation of the agency, consistent with this part,
to provide a program of special education to a particular child with a disability
that is an exceptionally costly program, as determined by the SEA, because the
child—
(1) Has left the jurisdiction of the agency;
(2) Has reached the age at which the obligation of the agency to provide
FAPE to the child has terminated; or
(3) No longer needs the program of special education.
(d) The termination of costly expenditures for long-term purchases, such as
the acquisition of equipment or the construction of school facilities.
(e) The assumption of cost by the high cost fund operated by the SEA under
§300.704(c).
(Approved by the Office of Management and Budget under control number 1820-
0600)
Examples of allowable decreases in special education spending or services
79
Source: Electronic Code of Federal Regulations: https://www.ecfr.gov/cgi-
bin/retrieveECFR?gp=1&SID=0177098e646de15cbeac6209b7bcaa09&ty=HTML&h=L&mc=true&r=SECTION&
n=se34.2.300_1204. Center for IDEA Fiscal Reporting.

District Management Group | Helping Schools and Students Thrive | www.dmgroupK12.com
206
Staff turnover and attrition: If special education teachers, administrators,
service providers or paraprofessionals leave the district voluntarily, (not laid
off) then the district’s special education spending may decrease by the amount
of their salaries plus fringe benefits. If staff leave and are replaced by less
expensive personnel, Maintenance of Effort can be decreased by the difference
in salaries and benefits. This includes staff funded by state and federal grants.
Fewer students on IEPs: If a district has fewer students receiving special
education services, due to, better general education interventions, more accurate
criteria, lower overall student enrollment or any other reason, then special
education spending can be reduced proportionately. This is calculated on the
absolute number of students, not the percentage of students in special
education.
Students in “exceptionally costly” programs leave the district: If a student in a
costly program leaves the district, graduates, ages out, or shifts to a program
that is not ”exceptionally costly”, then spending may be reduced by the cost of
the program plus related transportation expenses. Each state sets the threshold
for defining an “exceptionally costly” program. It may be an absolute cost such
as $30,000 or a multiple of a typical student cost, such as 4 times the required
per student spending.
Students in “exceptionally costly” programs move to less costly programs,
such as moving from an out-of-district to an in-district program: If a student in
a costly program can transfer to a program that is not ”exceptionally costly”,
then spending may be reduced by the cost of the original program plus related
transportation costs.
3. The ability to shift funds to some non-special education uses.
Up to 15% of IDEA part B funds (both K-12 and preschool grants) can be used for
remediation and intervention efforts (“Early Intervening Services”) for students
not on IEPs. These general education programs and staff, however, count
towards the district’s special education Maintenance of Effort calculation. This
District Management Group | Helping Schools and Students Thrive | www.dmgroupK12.com
207
allows the district to reduce special education spending, while adding reading
programs, counseling, drug and alcohol support, whole school behavior
programs, social workers, RTI or SRBI services.
If these programs don’t exist, had been cut/reduced, or would be cut/reduced
without the use of IDEA funds, then any savings from greater efficiency in
special education can be used to support these valuable general education
efforts.
4. If IDEA funding increases in a given year, then local special education
spending can be reduced.
If a district’s IDEA funding increases over the previous year, then the district
may reduce its spending on special education from its local budget by 50% of the
amount of the increase in IDEA funds. Given the large ARRA increases in IDEA
funding, many districts are in this situation.
There are three caveats.
1) A more complex formula comes into play if the district also uses some of IDEA
funds for non-special education “Early Intervening Services.”
2)The district must be classified by the state as “Meet Requirements” in special
education, which is different from AYP to be eligible for the 50% reduction.
3) The district can’t be classified by the state as having “significant
disproportionality”, otherwise the 50% reduction option is not available.
5. Reductions in staffing isn't protected, only spending
Often districts believe that MoE prevents reducing special education staff even
during tight budgets. This is not typically the case.
The requirement, subject to all the nuances listed above, controls spending not
staffing. Staffing and spending differ when staff receive wage increases year
over year. For example if staff received a 3% wage increase (including benefits),
then staffing levels could be reduced by 3% and still meet MoE.
Similarly, if inflation drives up costs of purchased services, then the quantity of
such services can be reduced by the rate of inflation.
Note:

District Management Group | Helping Schools and Students Thrive | www.dmgroupK12.com
208
The information contained in summary is for general guidance only. The
application and impact of laws can vary widely based on the specific facts
involved. Accordingly, this information is provided with the understanding that
the authors and publishers are not herein engaged in rendering legal,
accounting, tax, or other professional advice and services. As such, it should not
be used as a substitute for consultation with professional accounting, tax, legal
or other competent advisers.
What does this all mean for a typical district?
The first conclusion is that the conventional wisdom that “You can’t reduce
special education spending” is a myth. The reality is much more complex.
For many districts simply having zero increase in special education spending
would be helpful. In nearly all cases a district will meet Maintenance of Effort if
special education costs, including fringe benefits and transportation, are held
flat year over year. A common misconception is that Maintenance of Effort rules
require a district to maintain the same services, staffing patterns, and programs
year to year. They incorrectly assume that effort means staff and programs; it
only means spending- and with many exceptions.
Most districts experience some of the conditions that allow it to apply
exemptions to their Maintenance of Effort calculations, such as staff leaving,
total enrollment increasing, or benefit costs increasing.
By implementing programs that reduce the number of students that need
special education services, a district can further reduce special education
spending in two ways. Some IDEA funds can be used to support general
education intervention and still count as special education spending and
because as the number of students on IEPs decreases, so does the Maintenance
of Effort requirement.

District Management Group | Helping Schools and Students Thrive | www.dmgroupK12.com
209
To help gauge how big an impact applying the rules and exemptions are to a
typical school district, a hypothetical example is provided on the next page. It
assumes that the district has effectively implemented steps to raise student
achievement and control costs. For the purposes of this example it is assumed
that out-of-district placements meet the state definition of “exceptionally costly”
and in-district programs do not. While this is true in many states and most
situations, it will not be the case for every district and every child.
The hypothetical district can reduce spending on special education by over 20%
and remain in compliance with Maintenance of Effort regulations.

District Management Group | Helping Schools and Students Thrive | www.dmgroupK12.com
210
Special Education Maintenance of Effort Sample Calculations
80
District Profile
Year 1
Year 2
Change
Enrollment
1,000
1,100
1.0%
Total budget (all sources)
$15,000,000
$15,450,000
3.0%
Special education spending (including
transportation, benefits, programs and staff)
$3,750,000
$3,975,000
6.0%
Data Required for MOE Calculations
IDEA funds
$425,000
$437,750
3.0%
State support for special education
$500,000
$515,000
3.0%
% students on IEPs
10.0%
9.5%
-5.0%
Students on IEPs
100
96
-4.1%
Staff turnover/retirement rate
5%
Salaries and benefits of special education staff
leaving district
$80,000
Students out-of-district
7
5
Out-of-district students who graduate, age out, or
move
1
Students at out-of-district placements who return
to in-district programs
1
Average cost of out of-district-program, including
transportation
$60,000
$60,000
IDEA funds for general education remediation,
intervention, reading and counseling
$0
$65,662
80
This example is for a hypothetical sample district. It is not specific to Wyoming.

District Management Group | Helping Schools and Students Thrive | www.dmgroupK12.com
211
Maintenance of Effort Calculations
Myth - You can't cut spending or services
Required special education spending
$3,975,000
100.0%
Per the regulations
Prior year spending
$3,750,000
94.3%
Less reduction due to increased enrollment
($33,750)
-0.9%
Less reduction due to increased state support
($15,000)
-0.4%
Less reduction due to fewer students on IEPs
($142,500)
-3.8%
Less reduction due to special education staff turnover
($80,000)
-2.1%
Less reduction due to out-of-district students
graduating, aging out, or moving
($60,000)
-1.6%
Less reduction due to students returning from out-of-
district placements
($60,000)
-1.6%
Less IDEA funds for general education remediation,
intervention, reading and counseling
($65,662)
-1.8%
Total allowable reductions
($456,912)
-12.2%
Required Maintenance of Effort spending
$3,293,088
82.8%
Variance from Myth
$681,912
-17.2 %

District Management Group | Helping Schools and Students Thrive | www.dmgroupK12.com
212
Relevant Portions of Federal Regulations
81
Title 34: Education
PART 300—ASSISTANCE TO STATES FOR THE EDUCATION OF CHILDREN
WITH DISABILITIES
Subpart C—Local Educational Agency Eligibility
§300.203 Maintenance of effort.
(a) Eligibility standard. (1) For purposes of establishing the LEA's eligibility
for an award for a fiscal year, the SEA must determine that the LEA budgets, for
the education of children with disabilities, at least the same amount, from at
least one of the following sources, as the LEA spent for that purpose from the
same source for the most recent fiscal year for which information is available:
(i) Local funds only;
(ii) The combination of State and local funds;
(iii) Local funds only on a per capita basis; or
(iv) The combination of State and local funds on a per capita basis.
(2) When determining the amount of funds that the LEA must budget to
meet the requirement in paragraph (a)(1) of this section, the LEA may take into
consideration, to the extent the information is available, the exceptions and
adjustment provided in §§300.204 and 300.205 that the LEA:
(i) Took in the intervening year or years between the most recent fiscal year
for which information is available and the fiscal year for which the LEA is
budgeting; and
81
Source: Electronic Code of Federal Regulations: https://www.ecfr.gov/cgi-
bin/retrieveECFR?gp=1&SID=0177098e646de15cbeac6209b7bcaa09&h=L&mc=true&n=sp34.2.300.c&r=SUBP
ART&ty=HTML#se34.2.300_1203.

District Management Group | Helping Schools and Students Thrive | www.dmgroupK12.com
213
(ii) Reasonably expects to take in the fiscal year for which the LEA is
budgeting.
(3) Expenditures made from funds provided by the Federal government for
which the SEA is required to account to the Federal government or for which the
LEA is required to account to the Federal government directly or through the
SEA may not be considered in determining whether an LEA meets the standard
in paragraph (a)(1) of this section.
(b) Compliance standard. (1) Except as provided in §§300.204 and 300.205,
funds provided to an LEA under Part B of the Act must not be used to reduce the
level of expenditures for the education of children with disabilities made by the
LEA from local funds below the level of those expenditures for the preceding
fiscal year.
(2) An LEA meets this standard if it does not reduce the level of expenditures
for the education of children with disabilities made by the LEA from at least one
of the following sources below the level of those expenditures from the same
source for the preceding fiscal year, except as provided in §§300.204 and
300.205:
(i) Local funds only;
(ii) The combination of State and local funds;
(iii) Local funds only on a per capita basis; or
(iv) The combination of State and local funds on a per capita basis.
(3) Expenditures made from funds provided by the Federal government for
which the SEA is required to account to the Federal government or for which the
LEA is required to account to the Federal government directly or through the
SEA may not be considered in determining whether an LEA meets the standard
in paragraphs (b)(1) and (2) of this section.
(c) Subsequent years. (1) If, in the fiscal year beginning on July 1, 2013 or July 1,
2014, an LEA fails to meet the requirements of §300.203 in effect at that time, the
level of expenditures required of the LEA for the fiscal year subsequent to the
year of the failure is the amount that would have been required in the absence of
that failure, not the LEA's reduced level of expenditures.

District Management Group | Helping Schools and Students Thrive | www.dmgroupK12.com
214
(2) If, in any fiscal year beginning on or after July 1, 2015, an LEA fails to
meet the requirement of paragraph (b)(2)(i) or (iii) of this section and the LEA is
relying on local funds only, or local funds only on a per capita basis, to meet the
requirements of paragraph (a) or (b) of this section, the level of expenditures
required of the LEA for the fiscal year subsequent to the year of the failure is the
amount that would have been required under paragraph (b)(2)(i) or (iii) in the
absence of that failure, not the LEA's reduced level of expenditures.
(3) If, in any fiscal year beginning on or after July 1, 2015, an LEA fails to
meet the requirement of paragraph (b)(2)(ii) or (iv) of this section and the LEA is
relying on the combination of State and local funds, or the combination of State
and local funds on a per capita basis, to meet the requirements of paragraph (a)
or (b) of this section, the level of expenditures required of the LEA for the fiscal
year subsequent to the year of the failure is the amount that would have been
required under paragraph (b)(2)(ii) or (iv) in the absence of that failure, not the
LEA's reduced level of expenditures.
(d) Consequence of failure to maintain effort. If an LEA fails to maintain its
level of expenditures for the education of children with disabilities in
accordance with paragraph (b) of this section, the SEA is liable in a recovery
action under section 452 of the General Education Provisions Act (20 U.S.C.
1234a) to return to the Department, using non-Federal funds, an amount equal to
the amount by which the LEA failed to maintain its level of expenditures in
accordance with paragraph (b) of this section in that fiscal year, or the amount of
the LEA's Part B subgrant in that fiscal year, whichever is lower.
(Approved by the Office of Management and Budget under control number 1820-
0600)
(Authority: 20 U.S.C. 1413(a)(2)(A), Pub. L. 113-76, 128 Stat. 5, 394 (2014), Pub. L. 113-
235, 128 Stat. 2130, 2499 (2014))
[80 FR 23666, Apr. 28, 2015]
§300.204 Exception to maintenance of effort.
Notwithstanding the restriction in §300.203(b), an LEA may reduce the level
of expenditures by the LEA under Part B of the Act below the level of those
expenditures for the preceding fiscal year if the reduction is attributable to any
of the following:

District Management Group | Helping Schools and Students Thrive | www.dmgroupK12.com
215
(a) The voluntary departure, by retirement or otherwise, or departure for
just cause, of special education or related services personnel.
(b) A decrease in the enrollment of children with disabilities.
(c) The termination of the obligation of the agency, consistent with this part,
to provide a program of special education to a particular child with a disability
that is an exceptionally costly program, as determined by the SEA, because the
child—
(1) Has left the jurisdiction of the agency;
(2) Has reached the age at which the obligation of the agency to provide
FAPE to the child has terminated; or
(3) No longer needs the program of special education.
(d) The termination of costly expenditures for long-term purchases, such as
the acquisition of equipment or the construction of school facilities.
(e) The assumption of cost by the high cost fund operated by the SEA under
§300.704(c).
(Approved by the Office of Management and Budget under control number 1820-
0600)
(Authority: 20 U.S.C. 1413(a)(2)(B))
[71 FR 46753, Aug. 14, 2006, as amended at 80 FR 23667, Apr. 28, 2015]
§300.205 Adjustment to local fiscal efforts in certain fiscal years.
(a) Amounts in excess. Notwithstanding §300.202(a)(2) and (b) and
§300.203(b), and except as provided in paragraph (d) of this section and
§300.230(e)(2), for any fiscal year for which the allocation received by an LEA
under §300.705 exceeds the amount the LEA received for the previous fiscal year,
the LEA may reduce the level of expenditures otherwise required by §300.203(b)
by not more than 50 percent of the amount of that excess.
(b) Use of amounts to carry out activities under ESEA. If an LEA exercises the
authority under paragraph (a) of this section, the LEA must use an amount of

District Management Group | Helping Schools and Students Thrive | www.dmgroupK12.com
216
local funds equal to the reduction in expenditures under paragraph (a) of this
section to carry out activities that could be supported with funds under the ESEA
regardless of whether the LEA is using funds under the ESEA for those activities.
(c) State prohibition. Notwithstanding paragraph (a) of this section, if an SEA
determines that an LEA is unable to establish and maintain programs of FAPE
that meet the requirements of section 613(a) of the Act and this part or the SEA
has taken action against the LEA under section 616 of the Act and subpart F of
these regulations, the SEA must prohibit the LEA from reducing the level of
expenditures under paragraph (a) of this section for that fiscal year.
(d) Special rule. The amount of funds expended by an LEA for early
intervening services under §300.226 shall count toward the maximum amount
of expenditures that the LEA may reduce under paragraph (a) of this section.
(Approved by the Office of Management and Budget under control number 1820-
0600)
(Authority: 20 U.S.C. 1413(a)(2)(C))
[71 FR 46753, Aug. 14, 2006, as amended at 80 FR 23667, Apr. 28, 2015]
§300.226 Early intervening services.
(a) General. An LEA may not use more than 15 percent of the amount the LEA
receives under Part B of the Act for any fiscal year, less any amount reduced by
the LEA pursuant to §300.205, if any, in combination with other amounts (which
may include amounts other than education funds), to develop and implement
coordinated, early intervening services, which may include interagency
financing structures, for students in kindergarten through grade 12 (with a
particular emphasis on students in kindergarten through grade three) who are
not currently identified as needing special education or related services, but who
need additional academic and behavioral support to succeed in a general
education environment. (See appendix D for examples of how §300.205(d),
regarding local maintenance of effort, and §300.226(a) affect one another.)
(b) Activities. In implementing coordinated, early intervening services under
this section, an LEA may carry out activities that include—
(1) Professional development (which may be provided by entities other than
LEAs) for teachers and other school staff to enable such personnel to deliver
scientifically based academic and behavioral interventions, including

District Management Group | Helping Schools and Students Thrive | www.dmgroupK12.com
217
scientifically based literacy instruction, and, where appropriate, instruction on
the use of adaptive and instructional software; and
(2) Providing educational and behavioral evaluations, services, and supports,
including scientifically based literacy instruction.
(c) Construction. Nothing in this section shall be construed to either limit or
create a right to FAPE under Part B of the Act or to delay appropriate evaluation
of a child suspected of having a disability.
(d) Reporting. Each LEA that develops and maintains coordinated, early
intervening services under this section must annually report to the SEA on—
(1) The number of children served under this section who received early
intervening services; and
(2) The number of children served under this section who received early
intervening services and subsequently receive special education and related
services under Part B of the Act during the preceding two year period.
(e) Coordination with ESEA. Funds made available to carry out this section
may be used to carry out coordinated, early intervening services aligned with
activities funded by, and carried out under the ESEA if those funds are used to
supplement, and not supplant, funds made available under the ESEA for the
activities and services assisted under this section.
(Approved by the Office of Management and Budget under control number 1820-
0600)
(Authority: 20 U.S.C. 1413(f))
